I am relatively new to connectomics and have been using tck2connectome to produce my first connectomes. I have found mrview great for some visualisation, however I am struggling to find a convenient way to manipulate/examine this data. I was hoping there is some software that can use the tck2connectome .csv to produce connectome matrices, and which can combine my data for each patient group, and compare between them.
I have been investigating various software options for this, and note that connectome workbench is recommended, but it appears to require different inputs to the .csv that tck2connectome produces (or do I need to persevere with this?).
I wondered if anyone can recommend a simple (ideally gui based) tool that I can use for this, that can use the tck2connectome output.
mrview has a dedicated Connectome Tool that took me a long time to implement; I hope it hasn’t been entirely overlooked Admittedly the documentation pagereally needs to be filled with example images, but it was written way back when we couldn’t easily embed images in our documentation.
As far as “combining data for each patient group”, if you’re simply referring to calculating the mean of the connectomes across subjects within a group, this can be performed within any one of a range of softwares (e.g. Matlab, Octave, Python, …) and exported back to CSV.
Thank you for getting back to me. I have used the connectome tool in mrview for viewing the connectomes and it works really well for visualisation. I don’t think I have overlooked your hard work with it. The guide was good and easy to follow, even without images.
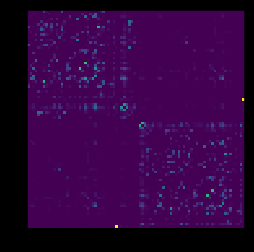
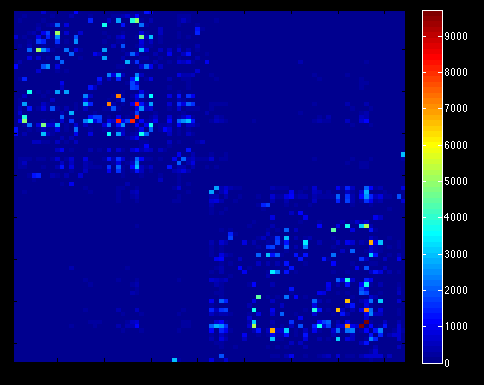
What I am looking for is an easy way to make matrices such as this (the SC one):
I don’t think the mrtrix connectome viewer does this, unless I have missed it?
I was also hoping that there was an easy way to run the various connectome graph metrics. I am sure that I can do this manually in matlab (with a lot of time), but was wondering if anyone was aware of something that would automate/help with doing this a little? Maybe that was a little hopeful.
What I am looking for is an easy way to make matrices such as this (the SC one) … I don’t think the mrtrix connectome viewer does this, unless I have missed it?
No, mrview doesn’t have any such capability. I kept connectome visualisation capabilities within the scope of “that that may sensibly be visualised in 3D space alongside other mrview capabilities”; matrix-based plots such as these aren’t located within 3D space, and simply weren’t worth the investment of development time since there’s all sorts of other softwares that can generate such. The latter of your two examples I’m pretty sure can be generated using the image visualisation toolbox in MatLab.
I was also hoping that there was an easy way to run the various connectome graph metrics.
There was some progress made on this, but the features are not yet available.
If you use python, MNE (https://martinos.org/mne/stable/index.html) can be used to make one of those connectome circle plots pretty easily. Load your labels and colors from the same file you used with labelconvert (I use a slightly edited version of FreeSurferColorLUT.txt), and make sure you use the -symmetric and -zero_diagonal options with tck2connectome. Here’s an example with code (I also exclude the cerebellum but left that out in the code for simplicity):
import mne
labels = []
    node_colors = []
    unknown_found = None
    with open('freesurfer_labels.txt') as f:
        for x in f.readlines():
            if unknown_found and x.split():
                labels.append(x.split()[2])
                node_colors.append(tuple([float(color)/255 for color in x.split()[3:6]]))
            if 'Unknown' in x:
                unknown_found = True

    node_angles = mne.viz.circular_layout(labels, labels)

    connectome = np.loadtxt(os.path.join('connectome.csv'))
    mne.viz.plot_connectivity_circle(connectome, labels, node_angles = node_angles, node_colors = node_colors )
Hi Jolinda,
thanks for your helpful example.
Since I am a beginner of python. I met some errors when I run the with loop.
ValueError: could not convert string to float: ‘duplicates’
I think maybe the problem comes from readlines?
And I also wonder what is ‘Unknow’? Is it default?
I don’t if these are too simple questions for you.
Looking forward you replay.
 Admittedly the
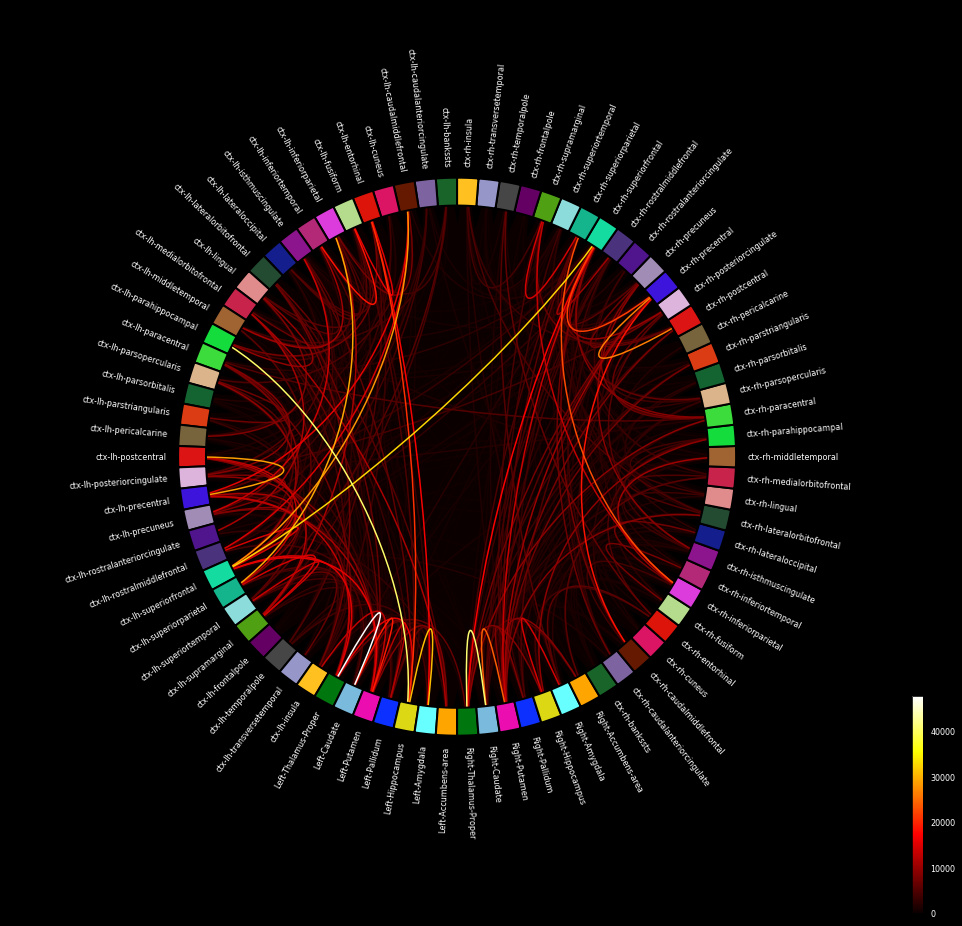