I followed this post to visualize endpoints from an ACT gm/wm interface in mrview and it works great.
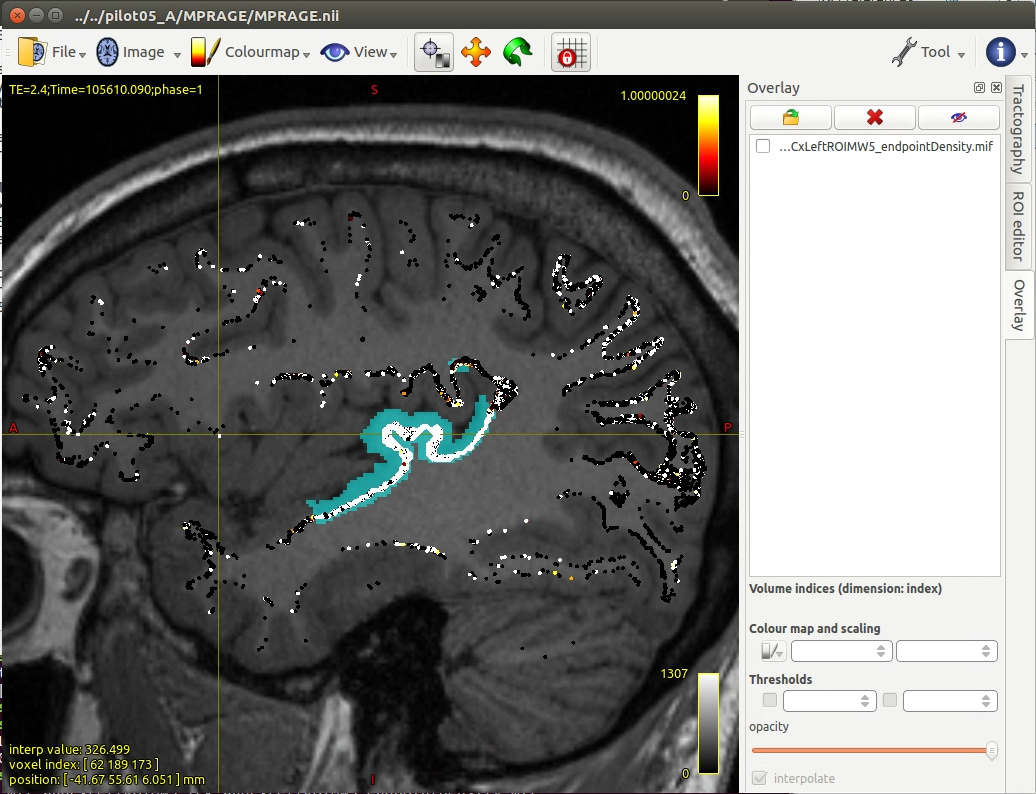
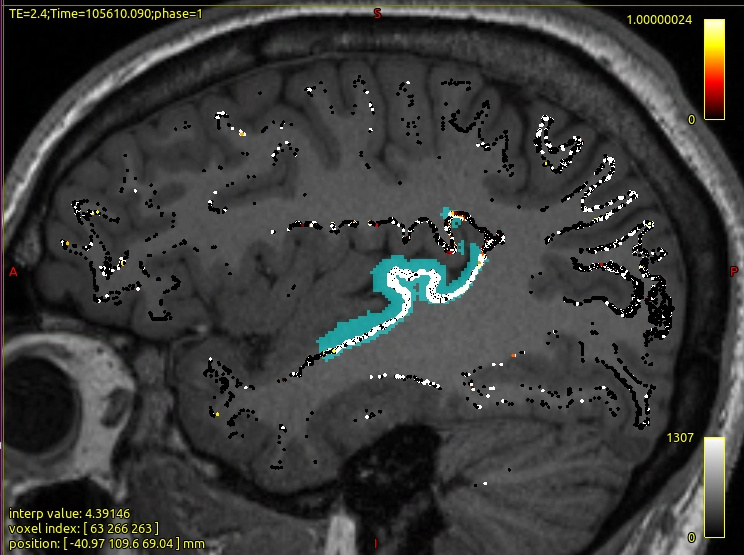
I wanted to color the endpoints as a function of whether they belong to a certain ROI, so I used tcksample to sample the endpoints from the ROI mask (zeros and ones), and used the resulting tsf file to color the endpoints, but I get unexpected results. I would expect all endpoints in the ROI to be white (scalar value = 1) and all endpoints outside the ROI to be black (scalar value = 0), but this is what I get:
While most endpoints within the ROI are white and the majority outside are black, I get some white endpoints outside the ROI and some black endpoints inside the ROI.
Could it be due to color interpolation ?
Is there any way to disable interpolation for track coloring using tsf files? Ideally I would ideally like to only see white and black dots, but there are some intermediate (yellow/orange) colors.
Here are the commands I used to isolate the endpoints of the tracks passing through the ROI and creating the tsf file:
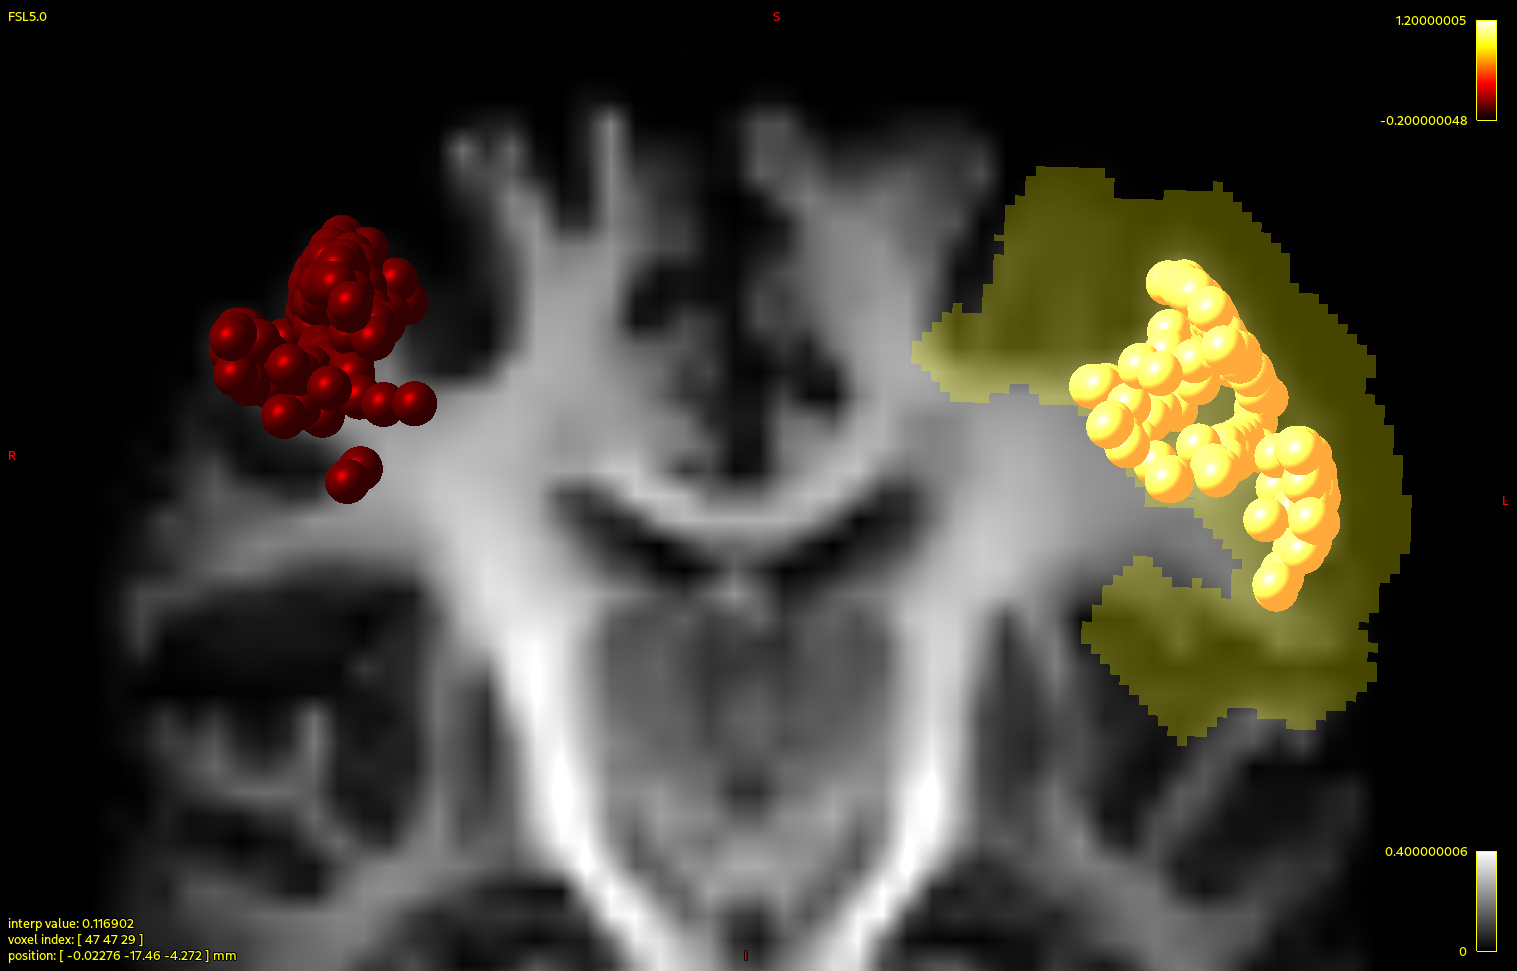
From reproducing your observation, I discovered an issue in mrview that actually predates the 3.0.0 release, but that would not be visually obvious until one does the kind of experiment that you’re trying to do here. Basically, the data accessed from a TSF file for either colouring or thresholding streamlines is erroneously being accessed from the previous vertex rather than the current vertex. Normally this might just sort of “shimmy” the colouring of the streamline over by a single step. But because the streamlines & TSF data are arranged in long stripes of data to feed to the GPU, when drawing the first vertex of a new streamline the TSF data may be accessed from the last vertex of the previous streamline. When only displaying the streamline endpoints, this basically makes half of the points in the image the wrong colour.
This fix produces a correct-looking image for me. If you’re compiling MRtrix3 from source code, feel free to give that code branch a try and see if you can get it to misbehave. There’s a few teething issues that have come up so the fix will hopefully get pushed out as part of a 3.0.1 update in the near future.
If you still can’t get the correct result from the updated code, it might be worth uploading your data and I’ll see if I can do the same on another system.
Also, is there an option to avoid the interpolated values (i.e. getting only back and white endpoints)?
I tested again and the fix seems to be working, even though I tested with the exact same version as above ( 3.0.0-12-g93339600). Maybe I was looking at the interpolated values and wrongly interpreted this as misplaced end points. Not sure what happened there.
Anyway, thanks for fixing and for the -nointerp flag!