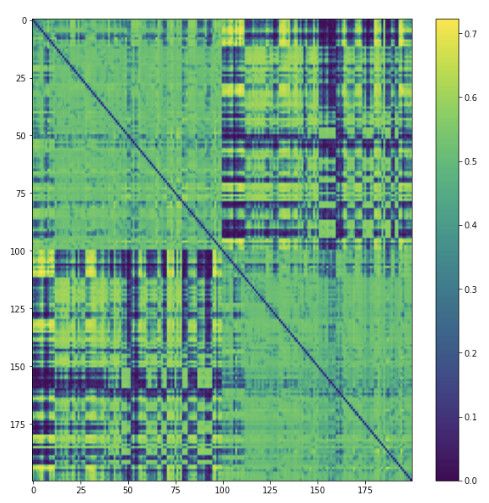
, with very little variations or clusters, especially within hemispheres. Am I doing something wrong? is this normal? I would have expected some more clusters.
thanks
Rosella
A mean FA-weighted connectome is expected to be relatively homogeneous in intensity, especially compared to something like streamline count where edges vary by orders of magnitude. You have a huge regression-to-the-mean effect of averaging values both along streamline trajectories and across the breadth of each bundle. And the FA “fluctuations” within the deep WM aren’t actually all that large. E.g. You can see that many inter-hemispheric connections have larger mean FA values that intra-hemispheric connections as they get the rare privilege of sampling values from single-fibre voxels for a reasonable fraction of their length.
Even if these data were to be “flatter” than other mean-FA-weighted connectomes, the connectome data would provide very little insight into such. If you hypothesize that two edges should be more disparate in mean FA than what you observe, you can try extracting those streamlines using connectome2tck, resampling the underlying FA values, and re-performing those calculations.
Otherwise, the only reasonable a priori hypothesis of what could cause such an effect is if the probabilistic streamlines are being permitted to disperse too much, which results in each edge sampling from a large fraction of the total WM instead of only a small sliver of it. This depends on your tracking parameters, which are not shown.
I see. Just one more question…since mean FA does not seem to be a significant metric for myelination degree of the tracts connecting two cerebral areas, which other metric quantyifying this “anisotropy of diffusion” do you suggest?
That’s an exceptionally wide-reaching question. There are some other metrics that attempt to capture the “magnitude of anisptropy” in each DWI voxel (e.g. Generalized FA). But I suspect from your question that even that is an erroneously specific answer. The notion of DWI being used as a specific metric of myelination is one that basically only exists outside of the field of diffusion MRI experts; it is a relic of early optimistic hypotheses regarding the origins of anisotropy of the DWI signal. Now, not only is the origin of such thought to be primarily cell membranes rather than the myelin sheath itself, there is the added confound of crossing fibres and orientation dispersion that makes attributing any difference in the DWI signal (even agnostic to any particular model) specifically to myelin highly dubious.
If your question is instead simplified even further to “what metric of connectivity should I be deriving between brain areas during connectome construction”, I can only point to this article that describes what I think is the most faithful implementation of what people are actually interested in when talking about “inter-areal structural connectivity”.