What's the minimal diffusion directions for FBA, and how to judge the peak delineation of FODs?

Dear editors,

I have a cohort with 40 diffusion weighted directions (several patients were 32 diffusion weighted directions) and a b-value =2000s/mm 2. However, some researchers consider with low angular resolution the derived FODs lack the sharp peak delineation in crossing fiber regions that is necessary to provide the enhanced tracking capability offered by CSD. Is the DWI parameter (40 diffusion weighted directions, b-value =2000s/mm 2) not appropriate for publishing paper of FBA?

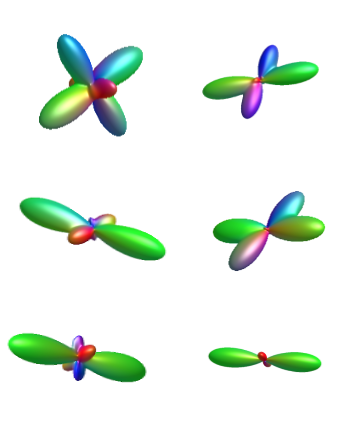
Here are FODs from the wmfod of my cohort, how to judge the peak delineation of FODs is sharp or not?

screenshots_2021-02-18 21.16.26

This a hard question to answer with a straight yes or no. Personally, I feel 40 directions are already enough to get good fODFs, especially with a moderate b-value of 2,000s/mm² – that’s already sufficient for spherical harmonic order lmax=6. What will determine the quality of the fODFs more at this stage is the SNR of the images. It’s hard to assess from your screenshots, but it looks reasonable from what I can see.

More to the point: sharp fODFs would be more important for tractography than for fixel-based analysis. There are steps in the FBA pipeline to minimise the influence of ‘broader’ fODFs or slight misalignment across subjects, so I think your data is sufficient for that. Besides, in the context of FBA, if your data are insufficient, that would be expected to reduce your statistical power to detect differences, but it wouldn’t be expected to introduce artificial differences in your results.

2 Likes

Thank you for your helpful reply! It is surprising to me that

in the context of FBA, if your data are insufficient, that would be expected to reduce your statistical power to detect differences, but it wouldn’t be expected to introduce artificial differences in your results

It improves my confidence of my positive FBA results that they are reliable!

There’s been plenty of FBA results published with even b=1000. Where having b<3000 becomes problematic is in the interpretation of any results you observe as being specific to a change in intra-axonal volume. What we’re ultimately extracting & measuring is a change in the magnitude of the DWI signal; it’s having sufficient diffusion sensitisation to kill the extra-cellular signal, and a long enough TE to kill the myelin-bound water signal, that allows the interpretation of whatever’s left as intra-axonal volume. So while you can still compute the measure that we refer to as “Fibre Density (FD)” from your data, and you can still analyse it; it’s merely the size of the caveat associated with the interpretation of that measure that’s slightly larger for b=2000 than for b=3000.

Thank you so much! So, it seems that the studies with b=1000 should be cautious to interpret their results

Dear Dr. Tournier @jdtournier , according to your above opinion (40 directions already sufficient for l max=6), is l max=6 enough for FBA analysis? However, a professional reviewer considers my data could be acceptable if I can verify that they were able to achieve a sufficiently high maximum spherical harmonic (lmax > 8; as determined by Tournier et al., 2013) for all subjects during CSD reconstruction. How can I solve this problem? Is there any published references to support the sufficiency of my data ( l max>6, but may be <8)?

In addition, you mentioned SNR of the images, how can check the SNR? Is there any quantitative metrics and cut-off values to judge the SNR of my images is good?

Thank you for your patience! :grinning:

1 Like

Dr.Pietsch @maxpietsch and Dr. Tournier @jdtournier, Could you help me to answer my updated questions above? Thank you so much!

Sorry about the delay, things have been a hectic of late with exams, marking, etc…

OK, this is a very grey area, and there will be lots of different opinions on the topic. I get asked this question a lot, and my answer is invariably a lot more nuanced than just setting minimum criteria. The reason for this is that there is no clear breakdown point as far as I can tell – more directions is always better (if only because it means more data), more SNR is always better, and higher b-values (up to ~3,000 s/mm²) is also better. But you can obtain remarkably good reconstructions with relatively few directions if you have good SNR, or with relatively poor SNR if you have enough directions/measurements. The one criterion I would impose is a minimum SNR in the b=0 images of at least 15 – lower than that and the Rician bias becomes really problematic, and a lot of the preprocessing can also start to deteriorate.

Regarding the reviewer’s specific objection, the paper they refer to does make recommendations for the sampling density required to fully capture all observable spectral features in the DW signal, which at b=2,000 s/mm², will indeed include the l=8 terms (figure 3). However, you’ll also note (figure 4 & table 1) that at this b-value, the amplitude of the l=8 terms is ~1% of the mean (l=0) signal. You’ll also see from figure 5 that the SNR required to even detect these l=8 terms (never mind actually characterising them reliably) is around SNR=60 for ~50% statistical power (more like SNR=80 for 80% statistical power) – and that assumes you have 100 DW directions. For your acquisition with 40 DW directions, the SNR required would climb to ~√(100/40) = ~1.6× higher, i.e. SNR≈95 (for 50% power) and SNR≈125 (for 80% power). In other words, when fitting at the single-voxel level (which is what you’re doing for tractography), the l=8 terms are completely lost in the noise for any realistic SNR level. Moreover, for CSD in particular, the non-negativity constraint would completely dominate any information contained in the l=8 terms – such constraints are not taken into account in that 2013 publication.

Finally, you can point to Figure 7 in that paper, which clearly shows that the fibre orientation estimates obtained using CSD at b=3,000 s/mm² do not improve beyond ~40 DW directions (when the effect of the increased number of measurements is accounted for – obviously in practice more DW directions always helps, but crucially, after that point, it helps by increasing the overall SNR, not the angular resolution). Note that this doesn’t suggest that 40 directions is always sufficient, but that it’s likely to be sufficient in terms of angular coverage for a realistic SNR level (with much higher SNRs, there would most likely be further improvements with more directions).

I will typically measure SNR by extracting the b=0 images, and measuring the temporal SNR in those images – i.e. the standard deviation of the signal across volumes, divided by the mean signal. I typically compute this voxel-wise and smooth the resulting image (using a wide median filter for example). This provides a spatial map of the SNR in the b=0 images, accounting for the fact that on modern multi–channel systems, the SNR is spatially variable. I would normally report the SNR as measured in the periventricular areas since these regions are reasonably representative – the SNR in the periphery will be much higher (closer to the coils), but much lower in the brainstem (much further from the coils).

As to the cut-off value, as mentioned above I would always recommend an SNR of at least 15 in the b=0 images – but more is always better!
1 Like