Dear All,
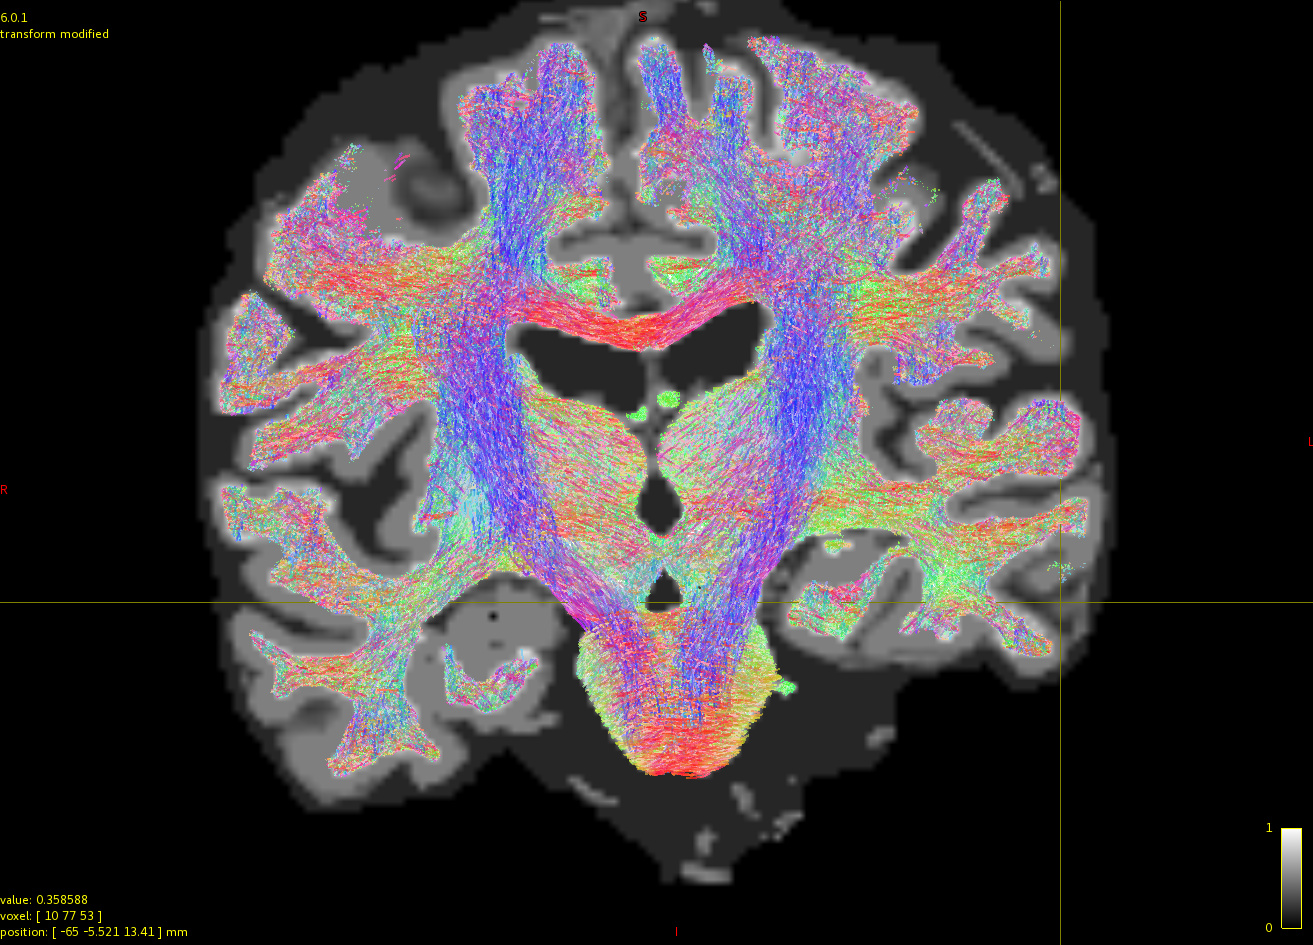
I have ran the anatomically contrained tractography on my DTI data with bvalue =1000 and bvecs= 56 directions. where I get the attached SIFT corrected tractogram but I am not sure it is correct or not.
So plaese have a look and let me know your point of views.
Streamlines stringently constrained within WM and SGM due to the use of ACT.
Spatial distribution of streamlines density (gauged by the amount of “empty space” in between the streamlines) is approximately equal across the white matter; this is not explicitly a constraint in SIFT, but tends to be what the FOD data suggest, and also makes sense from a physical perspective (if one can fit a certain density of fibres within a given volume of white matter in one area of the brain, why would the density of fibres be grossly smaller or larger than this elsewhere in the WM?).
The low-ish b-value means that the interpretation of FOD amplitude (and concomitantly streamline count post-SIFT) can’t be interpreted as being proportional to intra-cellular volume / cross-sectional area with confidence… but applying SIFT nevertheless is likely still preferable to omitting that step.
Thanks Smith for your response.
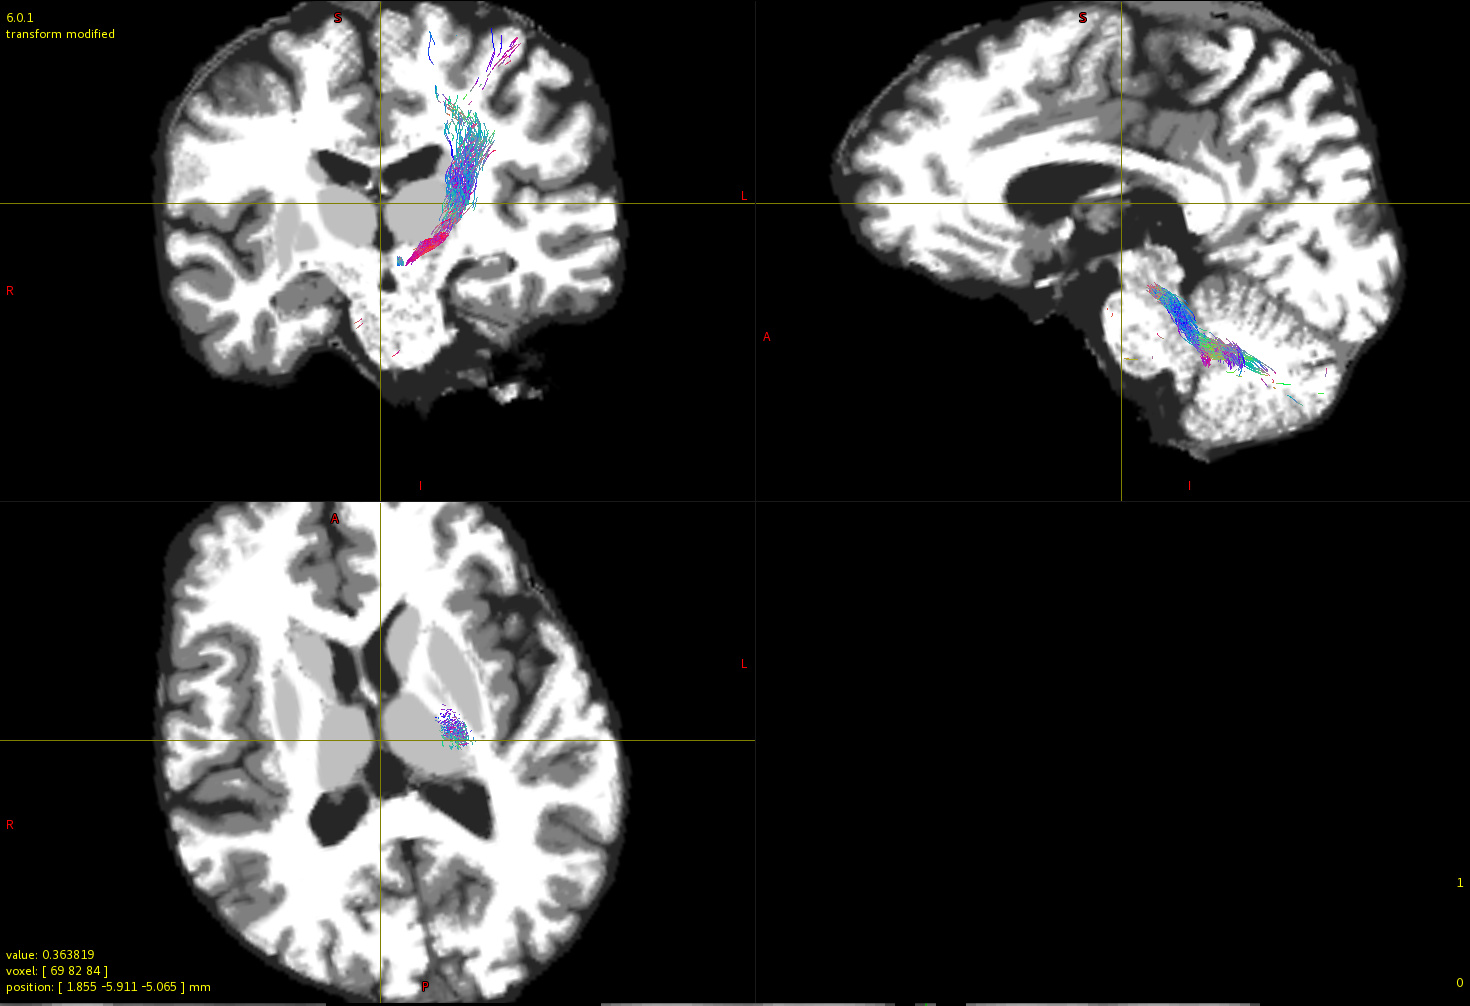
I have created a dentato-rubro-thalamo-cortical tract using the Same data but avoiding the ACT as I was not getting any streamlines after applying the ACT (I am not sure what is the region).
Now I want to calculate the fiber count reaching from dentate to thalamus. Could you please guide me How I can achieve this Goal.
Please guide me in further analysis.
Attached an image of the tract
Once you have created a track file containing only those streamlines of interest, examining the header of the track file using the tckinfo command will tell you how many streamlines are present in that file.