I would like to apply the constrained spherical deconvolution on my DTI dataset (30 directions, b=1000, 1 b0 image).
I tried to compute the response function with the command dwi2response an it gave me the response function I attached in this screenshot (“response.png”).
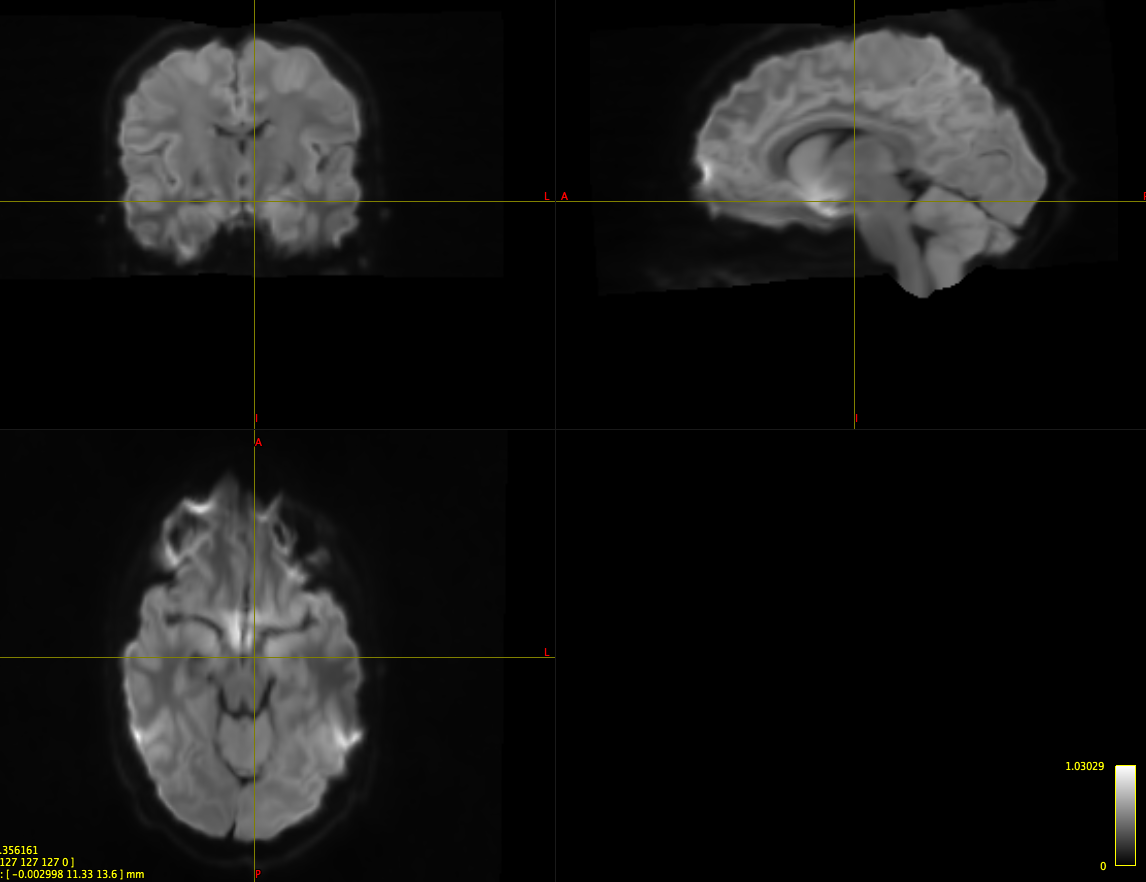
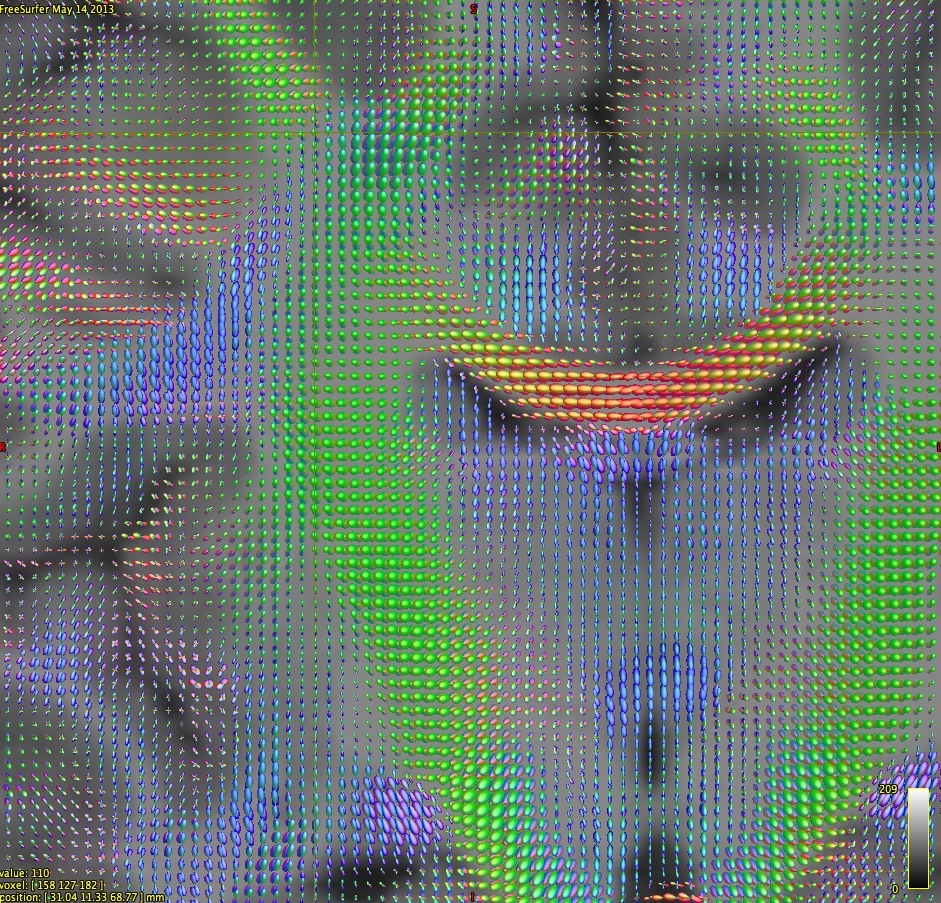
Do you think it is correct? I have further run the CDS (dwi2fod) that gave me the image in my screenshots: “CSD.png” and “FOD.jpeg”.
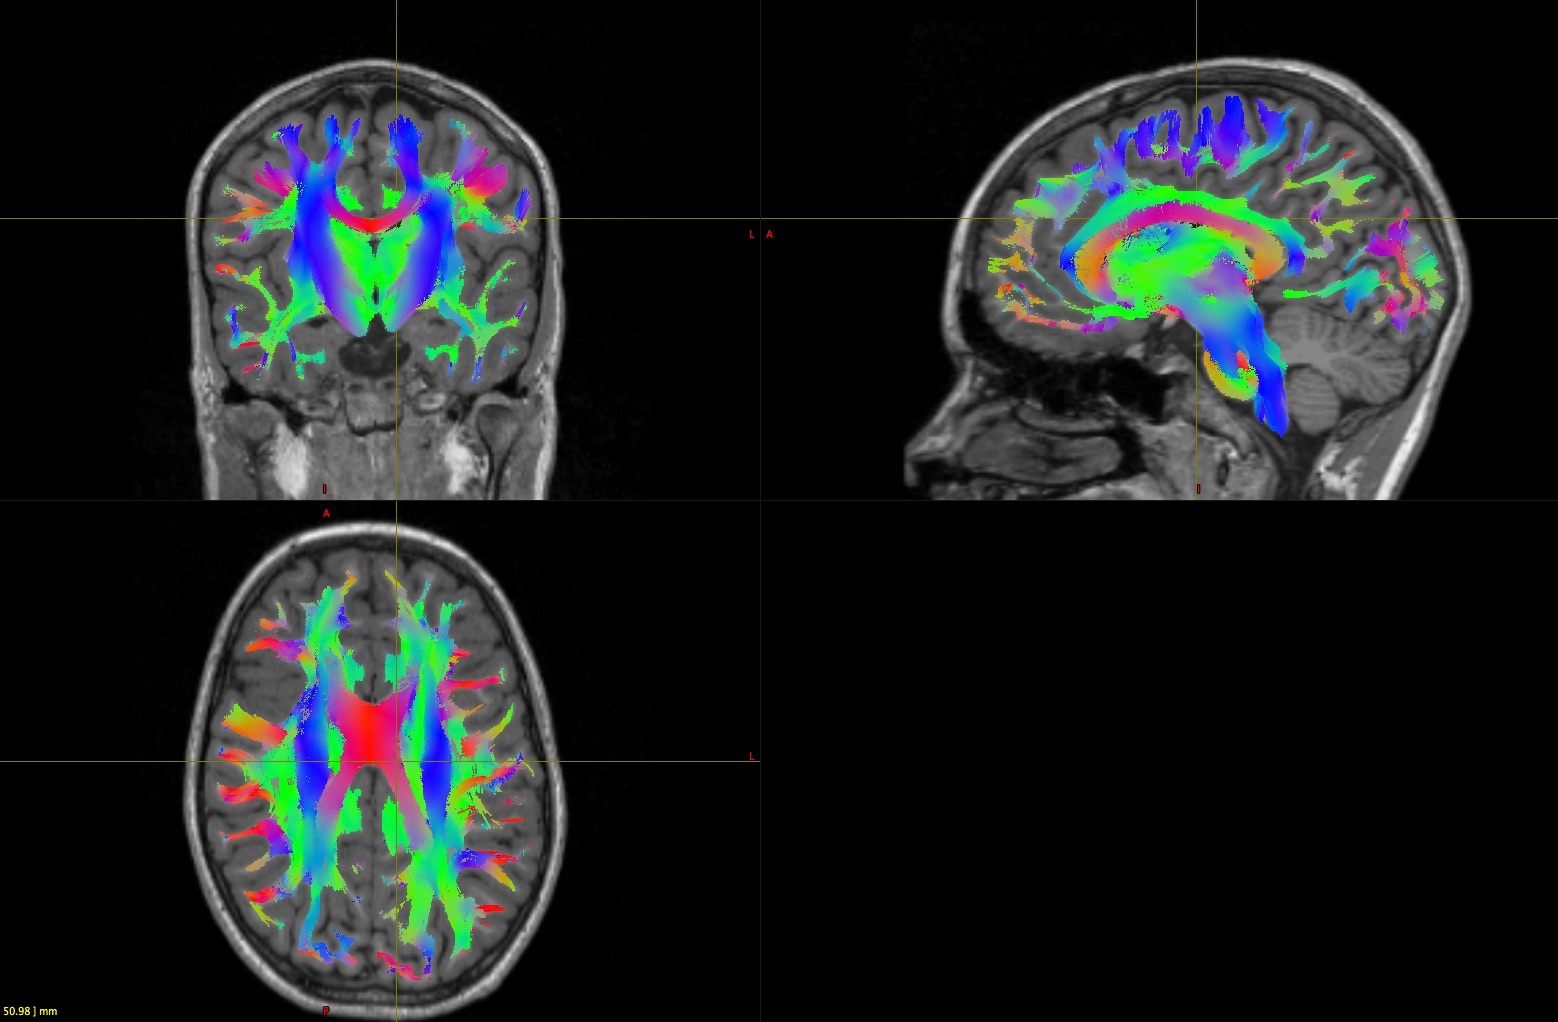
I have also run the tractography (SD_stream) and it seems to me that it worked well (“tracto.png”), but I was wondering if doing the CSD makes sense given the type of data and the response function I get.
Based on the FOD image, I’d say you’ve almost certainly got an issue in the definition of your diffusion gradient table. For example: The cortico-spinal tract appears green (indicating an anterior-posterior direction), while the cingulum tracts and fornix appear blue (indicating an inferior-superior direction). Note that this error will affect response function estimation in addition to the FOD output.
I would suggest going all the way back to the very earliest instance of the diffusion data (preferably the DICOMs directly from the scanner), performing some simple deterministic tensor tractography (tckgen -algorithm tensor_det), and checking to see if the orientations of the tracks in these regions is biologically correct. If it is, then some aspect of your image processing has introduced the error in the gradient table (note that there was an issue in an earlier version of the revpe_distcorr script that could potentially introduce such an error, so you could try updating MRtrix3 and re-processing your data). If not, then you will need to try to figure out what type of error has been introduced into the gradient table, and correct it manually.
We hope to eventually have a script to assist in identifying and debugging such issues in the future.
Yes, 30 DW directions at b=1000 is very much at the lower end of what would be acceptable for CSD. That said, it really depends on your SNR. You might find that if you have good images, CSD does a decent job. I’ve certainly managed to run it on 12 DW direction, b=1000 data, and while the output wasn’t great, it still gave remarkably decent tractography, considering the data. Not that I’d necessarily recommend using this kind of data, but if you absolutely have use these data, I think it can be done relatively well.
Looking at your data though, there’s two issues that immediately come up: one is your gradient table is not right: it looks like the y and z axes have been switched. Your corticospinal tract shows anterior-posterior directions (green) rather than the expected inferior-superior (blue), and vice-versa for the superior longitudinal fasciculus. You’ll want to double-check where this information came from and fix it… If the whole analysis was performed entirely within MRtrix3, using DICOM data as input, then there might be a bug in our DICOM handing (although that’s been very stable for a long time now). Let me know if you think there might be an issue here that we need to fix.
The other issue is that I’m not seeing fibres crossing in the expected places. This will probably be due to the response function being too fat - it certainly looks a bit too ‘blobby’ in your screenshot. I think @thijs has already suggested a few things in that respect on the old mailing list. We have indeed found that dwi2response has not performed up to expectations, and have put a bit of effort into fixing it recently. These changes are pending in the updated_syntax branch on GitHub - unless you feel confident switching branches on git and amending your installation (things have changed a fair bit on that branch…), I’d recommend you hang on for a week or two while we tidy everything up and update the main version.
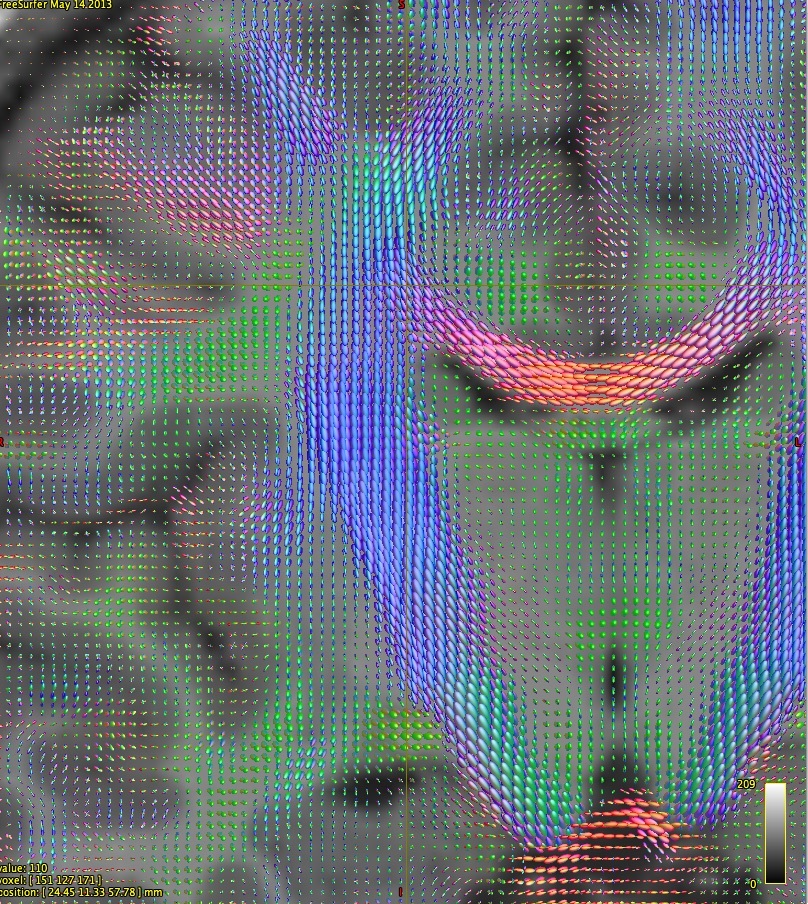
Yeah, so that definitely seems to be the case (I overlooked it in the initial email, but the FODs make it extra clear now!). After swapping the gradient table’s columns related to the y and z axes, you might also want to check whether you need to flip any column’s sign thereafter.
Unless this is due to an MRtrix-related bug beyond the stages of importing your data initially, it shouldn’t affect your response function estimation.
But as @jdtournier noted, there’s a striking absence of crossings in certain areas; which hints at a too low contrast to noise ratio, or an inappropriate response calibration. I can’t tell for sure, but I definitely have a feeling it’s going to (at least partially) be the latter, if you were using the dwi2response command… As I mentioned on the mailing list, I expect the issues we’ve been having with it to only get worse (or more likely to happen in the first place) for lower contrast to noise data (e.g., lower b-value data). I’ve definitely seen many cases where better results (including crossings) were obtained at b=1000 using the plain CSD (but typically using older, more direct, means of obtaining the response function.
Than you all for the answers.
So yes, my gradient table was wrong (and was not mrtrix fault as I computed it with another software).
Attached my new results. For the crossing fibres, should I wait for the updated version of dwi2response as suggested by @jdtournier?
I have also matrix2 installed on another pc. Should I try the estimate_response command instead, or are they equivalent?
The updated version of dwi2response will provide an option very similar to the MRtrix 0.2 estimate_response command, but we’ll be recommending a different approach again. However, I think it would be a good idea if you could have a go with estimate_response, if only to see what difference that makes to the FODs you’re showing. Hopefully it’ll produce much sharper FODs than what you have now, which at least will confirm where the problem lies…
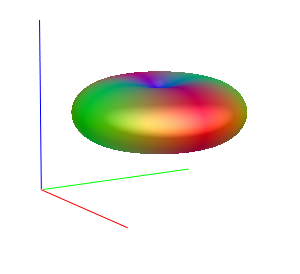
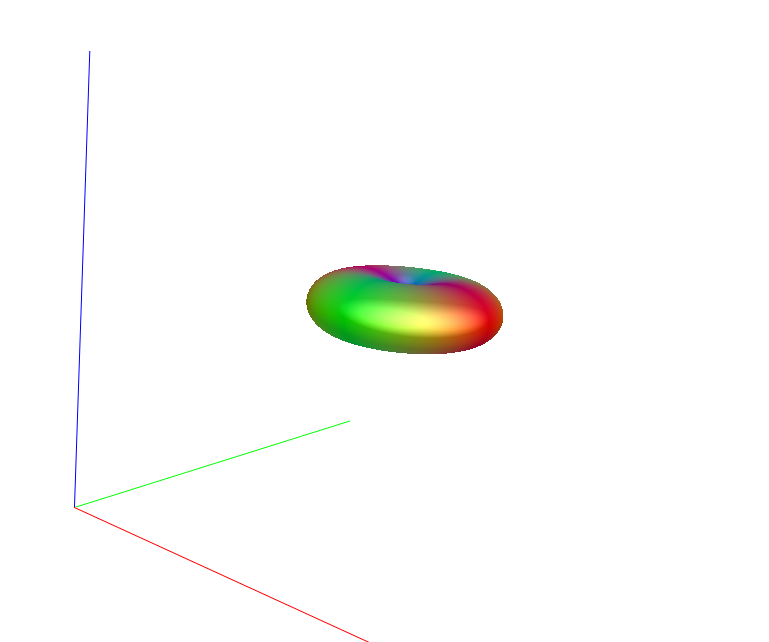
For reference, this is what I’d expect the response to look like at b=1000:
I wouldn’t read too much into the lack of crossing fibres in the initial results. The response function estimation has to rotate the signals from multiple voxels based on estimated fibre orientations so that they all align with one another; if the gradient table is incorrect, this process will be erroneous, and the signal averaging will result in the near-isotropic response function you initially posted.
I think the upcoming change to dwi2response will work better for low b-value data, primarily as it will enforce a fixed number of single-fibre voxels to be used in response function estimation rather than the data-driven iterative rejection of non-single-fibre voxels currently performed. But that shouldn’t prevent you from experimenting with your data; I would just put off starting any large batch processing until the change is pushed to users.
In my experience, the response function estimation works just fine even with a rotated gradient table - the estimated orientations are not correct anatomically, but still consistent with the gradient scheme. I expect the problem is genuinely that dwi2response didn’t do a great job on these data…
Sounds like you’re not in the main MRtrix folder when issuing this call. I’m not sure where you clone mrtrix3, but on my system, it’s in ~/mrtrix3. So I’d need to invoke:
Good to hear. As to the conversion to trk format, we have a conversion tool called tckconvert, but unfortunately it’s quite limited and doesn’t support trk format at the moment. There are other tools out there like dipy that may be able to do the conversion. Otherwise, there is Matlab code in the MRtrix3 folder to read tck files, so if you have code to write trk files, that could be an option.
If this is something that users would find useful, it might be worth adding this format to tckconvert - maybe we should open this as a feature request on GitHub…? I’ve no experience with this format, but assuming it’s not too obscure, it shouldn’t be too hard to do. The bigger issue is whether any of us will have any time to look into this any time soon…
I’ve added that format to Issue #411 on GitHub. It’d be nice to be able to seamlessly read from other track formats; but as you say, it’s hard to prioritize.
The request for TrackVis support came up on the old Google+ forum before. I was sure we already had a GitHub issue for this, but can’t seem to find it… Anyways, Rob now added it to #411. It shouldn’t be too hard…
Thank you all for the answers.
The Nipype script worked perfectly for displaying the tracks in trackVis. But, I also need to transform the starting and ending points of the tracks in RAS coordinate, in order to display them on the freesurfer cortical surfaces. I have a script that works on the .trk files generated by trackVis, but it does’t work on the .trk files transformed from .tck format.
I was wondering if there is a script (or a transformation matrix) transforming directly starting and ending points of the tracks in .tck format to RAS coordinates.
If you use the read_mrtrix_tracks.m matlab function you can load .tck files into a matlab structure. Then run a simple loop to keep the first and last coordinates of each streamline in the .data structure.
The streamline coordinates should be in mm space which you can then match to freesurfer vertices as follows…
Load a freesurfer surface (e.g. lh.white) into matlab using the read_surf.m function provided in the set of freesurfer matlab functions. The vertex_coords variable gives mm coordinates of each vertex. You can then find the Euclidean distance between an end point and the vertices to find the nearest vertex for a fiber termination.
Freesurfer then has a bunch of matlab functions to write surface overlays or annotation files depending on your desired outcome (e.g. save_mgh).