Hi,MRtrix experts
I followed https://mrtrix.readthedocs.io/en/latest/fixel_based_analysis/mt_fibre_density_cross-section.html#assign-subject-fixels-to-template-fixels and finished 1-22 steps.
I take two subjects two timing to try to analyse(001:subject one;002:subject two;pre:preradiotherapy;after:after radiotherapy).And,Group A:001_pre,002_pre;Group B:001_after,002_after.pre=control,after=patient.
I want to view one subject’s FD(FC,and FDC) value in one time plot.But I don’t know if what I display is true.
Take 001_pre as example:
FD:
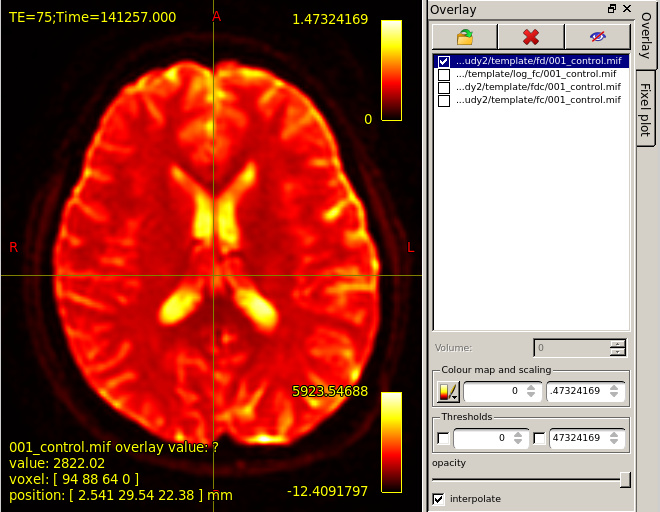
mrview dwi_denoised_unring_preproc_upsampled.mif
then overlay template/fd/001_control.mif.Colourmap choose Hot.Then,the result is shown in this figure.
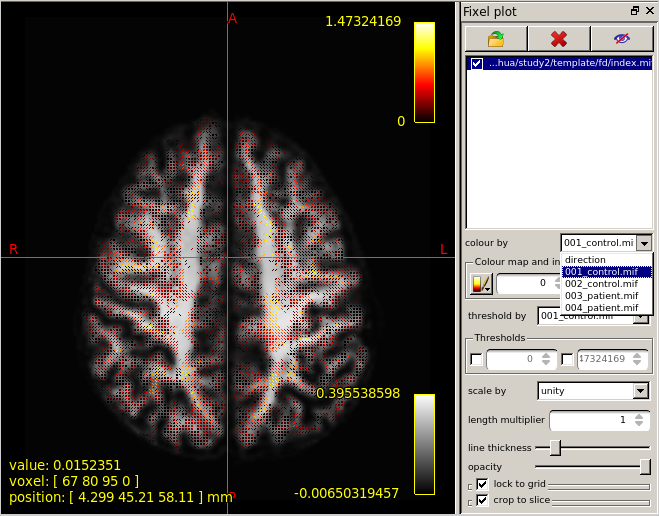
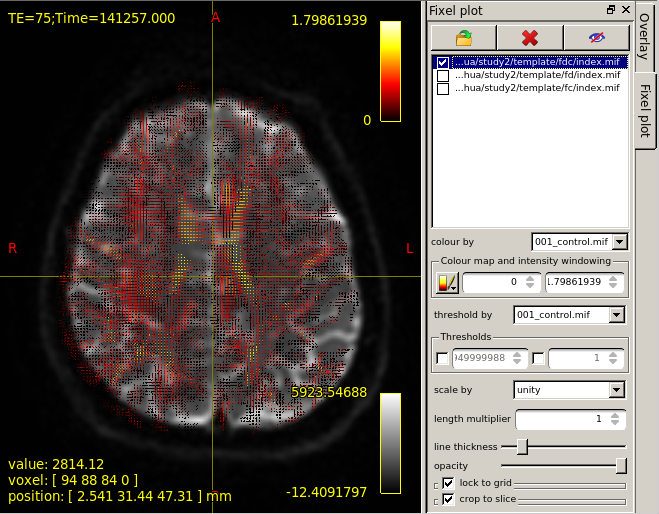
However,base on the “mrview” above,I choose fixel plot and overlay template/fd/index.mif.The result is shown in figure 2.
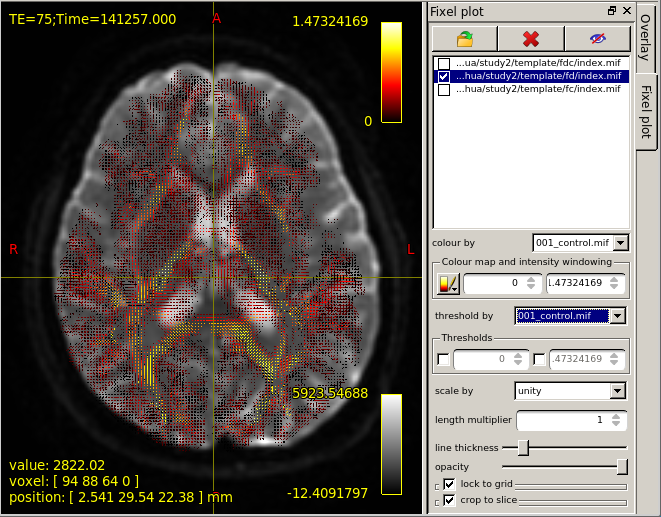
I don’t know what the FD(FC,FDC) value actually look like and the correct way to display FD(FC FDC) value.
FC:
And,when I view FC from my processed data,I can’t believe my eyes.
mrview mrview dwi_denoised_unring_preproc_upsampled.mif
overlay template/fc/001_control.mif.Colourmap choose Hot.Result as the third figure shows.It seems that there is no difference between Figure1 and Figure3.

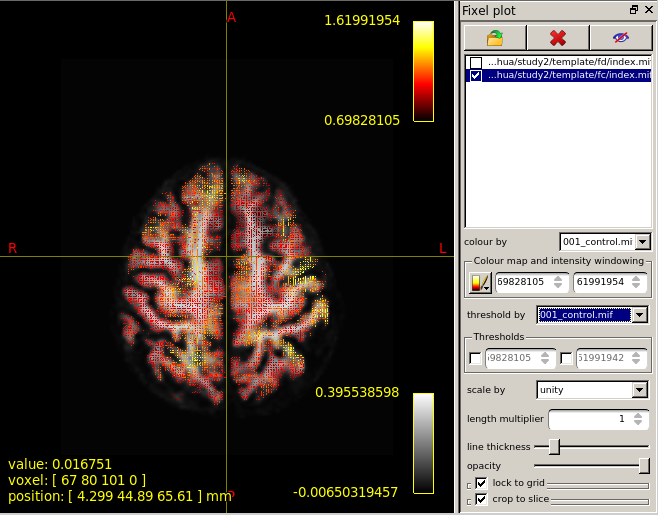
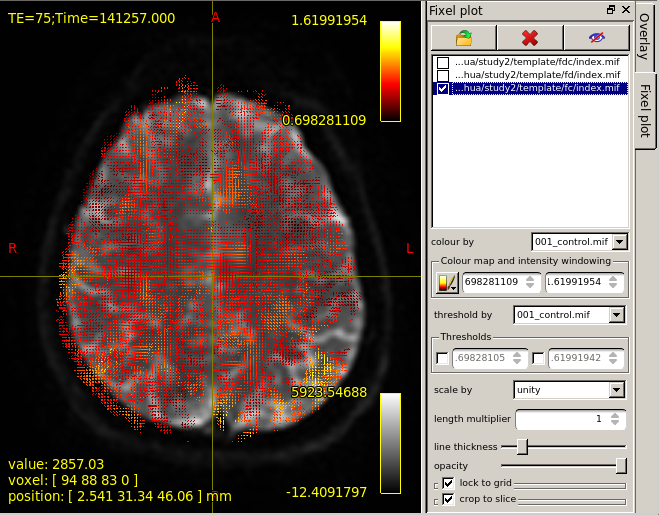
Then,I choose fixel plot and overlay template/fc/index.mif.The result is outrageous. The resulting map goes beyond the region of the brain.
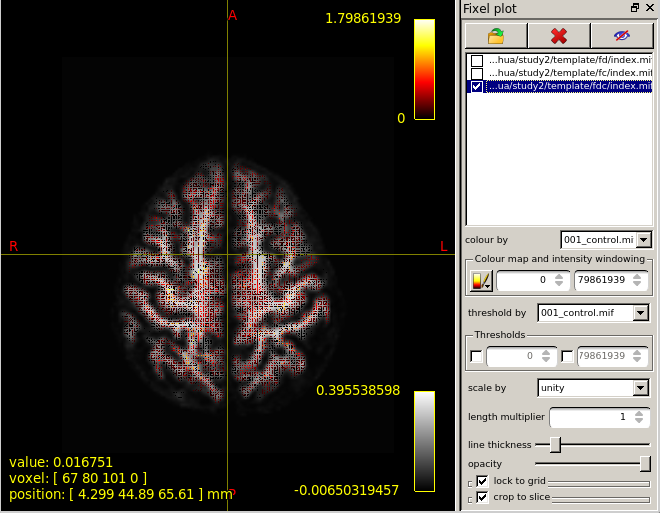
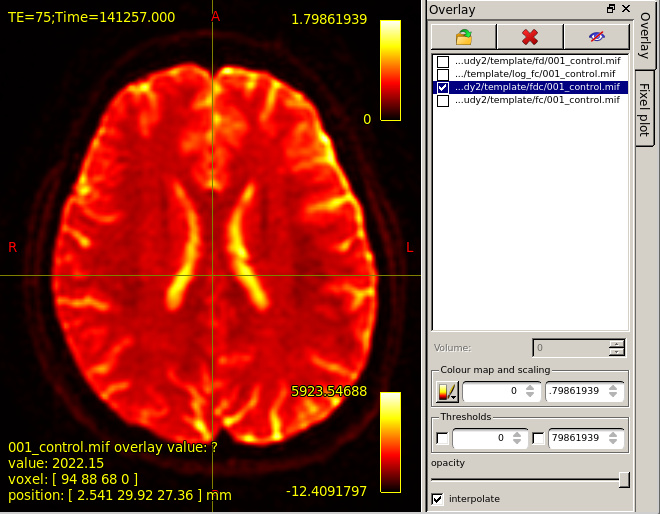
FDC:
like above.Figure 5 is the result of I overlay template/fdc/001_control.mif.Figure 6 is the result of I use “fixel plot” to overlay
In a word,what I displayed are awful.Three figures of overlaying FD,FC,FDC value are not so different.What’s more,“fixel plot” of FC and FDC resulting maps beyond the region of the brain.
How can I solve these problems?
And,in Step 23,base on my test dataset,how should I set the design_matrix and contrast_matrix?How can I visualise the fixel-fixel connectivity matrix generated in Step 21?
I would be very grateful if you could help me solve this problem.
Thanks,
Silver