I am interested in knowing the orientation of specific WM fibres with respect to the B0.
I read some papers from people who have done this using DTI where they computed the angle between the V1 and the B0. I was wondering if such a thing can also be done using mrtrix.
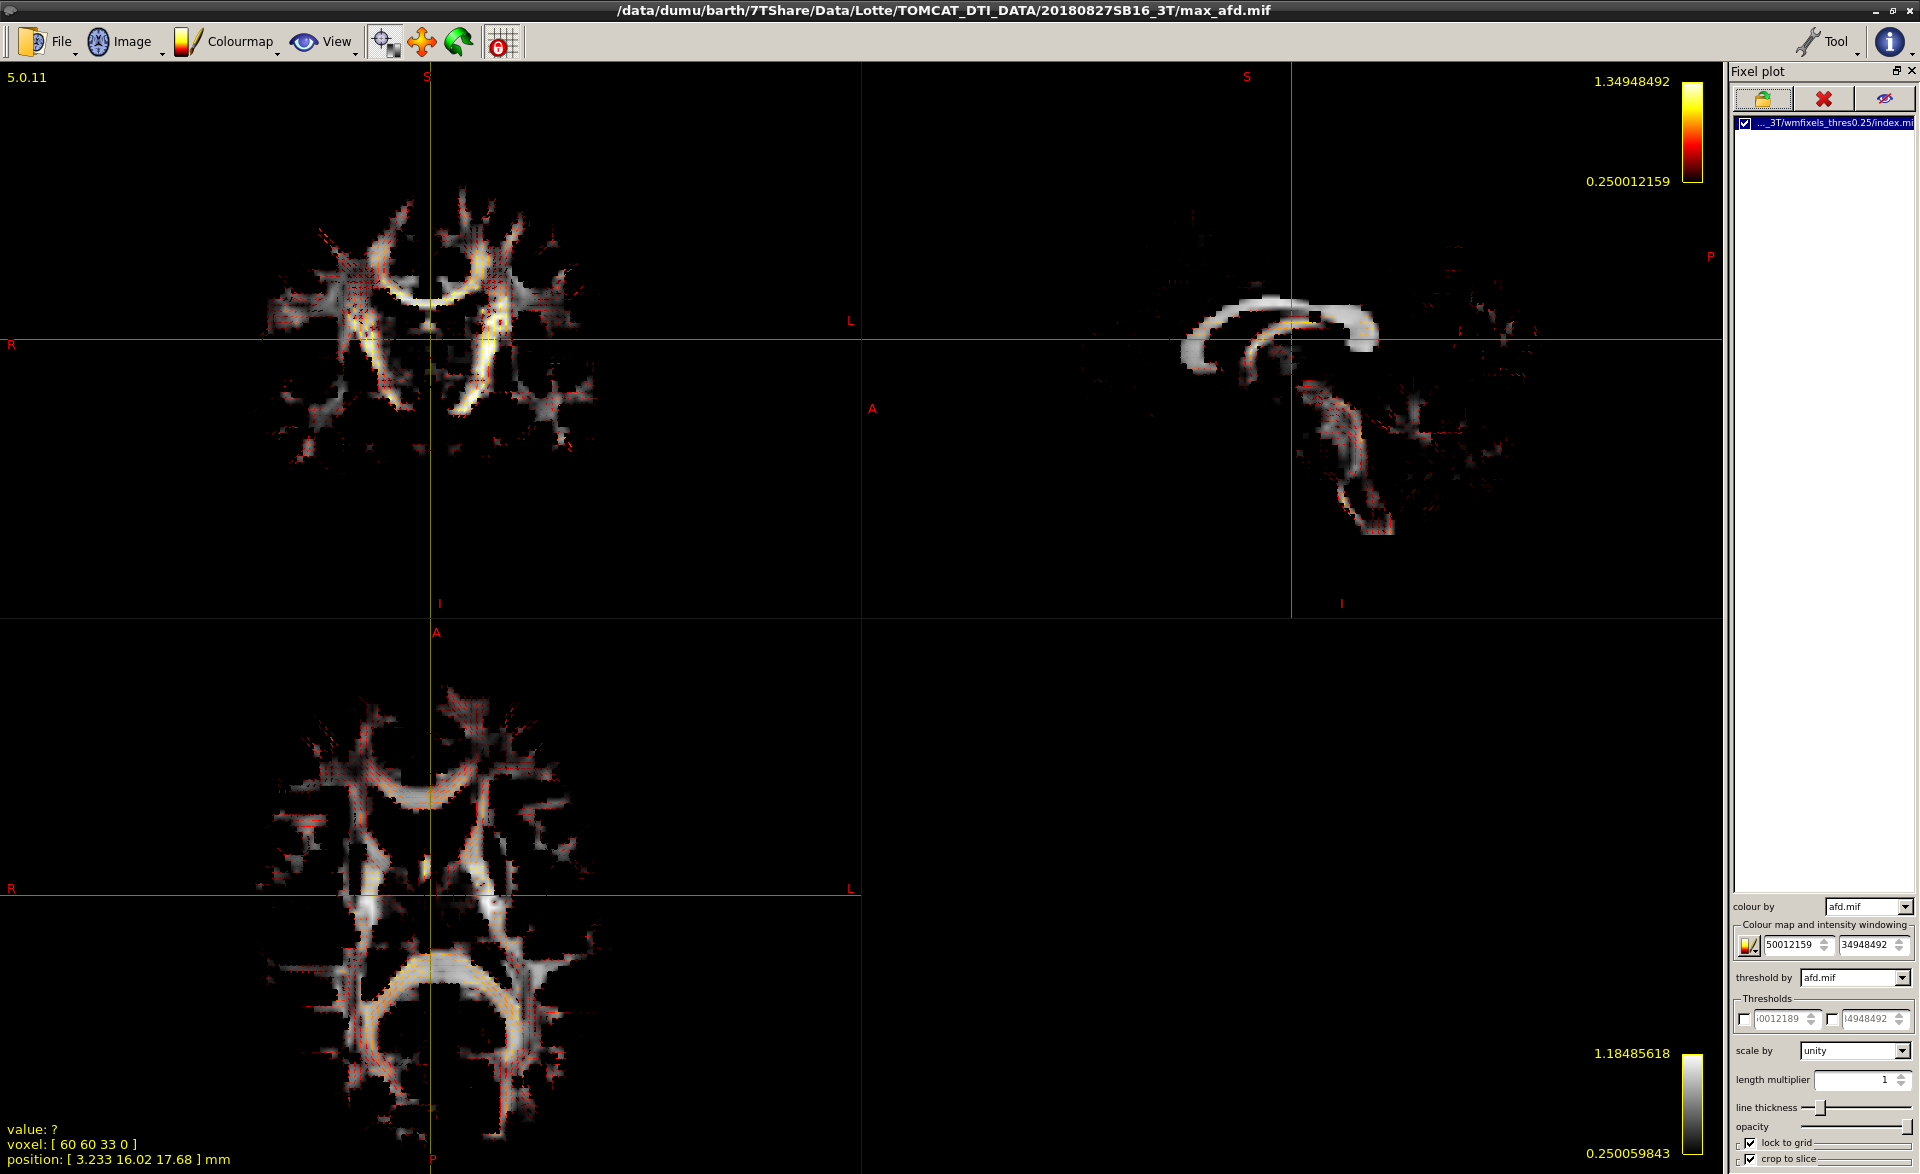
Is it possible to compute the (mean) direction of the FOD or fixel? I have noticed that in the output directory of the fod2foxel command there is a file called directions.mif. When I try to open this file using fixel plot on for example the tissue signal contribution map it seems to give the exact same result as the other index file in that directory. In fact, if I open the directions file it shows that I’ve opened the index file in the toolbox fixel plot. Any thoughts on what’s going on here or how I could correctly open the directions.mif file?
If you’re using fixel data, you’ll need to take a close look through the documentation to understand what’s going on. But the viewer will always load both the index.mif and directions.mif files together whenever you open these types of data, since the index.mif contains information about the number of fixels in each voxels and where to look for their associated data in the other data files, while the directions.mif file contains just a long list of directions for each of those fixels.
I think you should be able to extract the information you’re after from fixel data with commands like this:
For the above, you might want to verify that the peak1_directions.mif file contains unit vectors, I’m not sure about that bit – but it’s critical for that last acos(vz) operation to be valid…
The idea was to use fixel data instead of doing it via DTI, assuming that the first gives more accurate information on the orientation because it makes use of the csd.
I’m not sure if I completely understand the 3 lines of commands you provided. Does the first line extract the largest fixel in a particular voxel? Because I assume that is the fibre orientation that I am interested in.
Yep, that’s a good motivation, I reckon. But part of the point of obtaining a full FOD, is acknowledging there’s multiple fibre orientations in a voxel of course. So to add some nuance to this:
Yes, a fixel generally has a direction (there’s multiple definitions of what that direction could “exactly” be, but that’s besides the point). A mean direction of the entire FOD “as whole” of course makes less sense if there’s multiple fibre orientations (i.e. multiple fixels). So it depends here what you are specifically after.
Yes, that’s more or less correct. So in case of crossings, you’ll only get the direction of 1 fibre population (fixel), but it’ll be “the largest” one though (so that’s sensible). The other commands Donald showed will then compute the exact angle between that largest fibre population for each voxel and output that as a map of the angles you’re after (between fibre population and B0).
So that does “ignore” all other fibre populations in voxels where more than 1 population is present; however, the one that it does select, has its orientation measured more accurately than you’d get from DTI. In case of crossing fibres, DTI becomes unpredictable: the orientation could be close to the largest population, but it could also be anywhere in between the largest and (any number of) other populations.
So @jdtournier’s suggestion is the most sensible thing, I think, you can do if you want an accurate angle between the “largest” fibre population in each voxel and B0, mapped to a voxel-wise image so you can easily show it (as a voxel-wise image) or analyse it (as a voxel-wise image) if that’s what you’re after. Beyond that, you could also map this angle for all fixels in each voxel, but that would then also be a fixel image of course, with an angle for each fixel in each voxel. Depending on what you want to do with the result, maybe a fixel image is not what you want to deal with…?
The goal is to compare R2* values to the fibre orientation and see how those relate, so I reckon a voxel image would be necessary in order to do so.
You’re right, I was a bit sloppy with my words.
A couple of other questions:
If I want to calculate the angle of the second largest fixel wrt B0, I change the number in the first line to 2 and the coordinates to 3 5, right?
Is there a way to visualise only the second largest fixels? Looking at the peak_direction.mif when using -number 2 gives both the largest and second largest fixels. Is there any way to extract only the second largest one from that file? Not really an important thing but would be nice for visualising the process.
What exactly is meant by the ‘largest’ fixel; is this based on the afd?
Yep, sensible. Even there though, there were a few “options”, but again purely depending on what you exactly want. Just as a random example (maybe not desirable though), you could e.g. compute the angles for all fibres individually, but then in the end still average those angles.
But it appears you are indeed after single “largest” or further on, “second largest”, etc… individual fixels. So each time just 1 fixel per voxel, which you can then indeed capture in just a voxel, as there’s only 1 thing per voxel to deal with.
So well, not per se: there’s many things you could do that make sense (or don’t make sense). But it’s clear now!
Unless I’m overlooking something myself, that sounds alright to me. You can always change the number in the first line to 2, or 3, … to get the 2 or 3 or… largest fixels. Each 3rd volume has the z-component of each orientation then indeed; so those are found at volume 2, 5 (the 5 you mention here), 8, … for all orientations you extracted.
You could only extract the volumes related to a single orientation, and just show that. So following from your example here, you could do:
mrconvert peaks.mif second-peak.mif -coord 3 3:5
The " : " in there is to specify a range. So this extracts volumes 3 to 5 (i.e. 3, 4 and 5) along the 3rd axis. That then only has the second peak. Note though, that single-fibre voxels’ “second peak” might just be a nonsensical little noisy peak or no peak at all (the reality being that “there is no second fixel”). Just give it a go and see what that means in practice (best appreciated by effectively visualising as you’re thinking about indeed) .
This depends on how you might’ve extracted the fixels from the FODs (fod2fixel). Well, what metric you extracted for them. There’s 2 main choices of interest there for what you’re doing: -afd and -peak. The first one is the integral of the entire FOD lobe associated to the fixel, the second one is only the maximum amplitude at its peak. The concept that best goes with a notion of largest would be -afd, or the integral of the lobe. That’s the thing we call, e.g. in fixel based analyses, the (“total”) (A)FD of the fixel. It’s the number that’s typically said to be proportional to intra-axonal volume, if your b-value is sufficiently high. It’s also proportional to a few other things as well though, so not specific to intra-axonal volume only, especially between different WM tracts, or even different parts of the same tract.
Note that fod2fixel also has options to constrain what can even pass as a fixel (the segmenter options): by default this is a certain peak value. You can also make that into an integral value.
In the end though, I suppose your application isn’t critically dependent on the “exact” definition of an exact concept of “largest” (and due to what I mentioned above, that’s actually also not “exactly” in there to begin with, sometimes even further from it than you might expect). So the defaults should be good, I reckon; and just go with the -afd option if you need to extract a common metric (that you can stick a name on ). Do open up your fod2fixel result in the fixel plot tool to see if the -fmls_peak_value default itself makes sense for your data. If you see too many noisy fixels, increase it. If you’re missing obvious parts of WM tracts, decrease it.
In response to some of the things you explained, I have a few more questions.
Do you have a suggestion about a reasonable value for the integral threshold? For example; would 10% of the afd be a good choice? Or would it just really be a matter of trial and error? I’m fairly new to DWI so have little knowledge about where (not) to expect crossing fibres but I’m guessing the corpus callosum shouldn’t have too much crossing fibres?
I assume when using the integral as a threshold I need to chance the default of the peak threshold to zero? Or will mrtrix only use the manually provided threshold?
What exactly do you mean by how I’ve extracted the fixels? Do the options (afd, peak, dispersion) that I apply to the fod2fixel command influence how this command works? I thought it was just a matter of what else besides index.mif and directions.mif is calculated (as a separate file)…
One last question; is it possible to extract the afd (map) for peak fixels (so for example the largest fixel)? It is possible to to this for all fixels and modulate/colour code the fixel display by afd or directions etc but when extracting the largest fixels as I’ve done here…
…I’m only able to modulate the fixels by direction in mrview but not by afd or the peak. So my questions is, how do I do this and can I get a afd.mif file for only the largest fixels instead of all fixels?
Trial and error. Well, that maybe sounds a bit too random. It’s more anatomically guided trial and tweaking.
No, at least not the midbody of the corpus callosum. But beware genuine partial voluming with e.g. the fornix, the cingulum bundles and such though: they might not be interdigitating with the corpus callosum, but they do sit very closely snuggled up to it though: so it’s not unusual to see voxels with crossing fibres where they “touch”. Good bits to check is the “end” bits of bundles towards the cortex and even in the cortical gray matter: those are the areas where not only false positive lobes and fixels might start to appear, but more importantly, where they then quickly appear in larger numbers. You might for instance see voxels there that suddenly have 4, 5, or even many more fixels. Those are certainly false positives, so if you see many of those, you might want to try to increase thresholds. Another sign would be fixels “beyond” the cortical GM that seem to “bridge” the gap between left and right hemispheres of the brain across the mid-line, where CSF should be sitting in between. This is a tricky one though: limited spatial resolution might mean you genuinely see fixels from both hemispheres “touching” there (i.e. sit in neighbouring voxels) and form a bridge across hemispheres; so this might not at all times be wrong or a problem. But again, if you see many appear, you’ll probably see false positive fixels pop up in other places (cortex, etc…) too. The other way around, observe what you get for a low threshold in typical crossing regions in “deeper” WM regions: 2 or in some regions of the centrum semiovale 3 fixels are not unusual. They make sense if they seem to form consistently continuous patterns across many voxels (i.e. you can visually trace tracts through them over larger distances). If of some of those seem to in turn start to disappear when increasing the threshold, you’re starting to have some false negatives. You can’t win this game though: at some point you’ll still be removing false positives while already losing true positives (and thus generating false negatives). It seems to me that, for your research question, you’d rather be on the conservative side of the balance: false positives introduce a lot of nonsense in your measurements, but having a few false negatives (which are then very likely only related to very small amounts of WM, since the fixel AFD is very low!) isn’t all that dramatic. You could even argue you’d want to not take into account even genuine fixels that have very low AFD because of this. So I’d recommend to make sure your fixels look rather clean(ed up); if in doubt, rather go for a slightly higher threshold value instead of a lower one.
Yep, that’s correct. You could instead also (just only) play with the peak value threshold of course. As mentioned above: I’m quite confident that, for your application, it’s not so crucial which one you exactly choose here. If you’re having (practical) problems with the integral, safely opt for the peak amplitude to threshold. But if you only want to threshold by integral, you should set the peak threshold to zero. Play around with a few values for both (separately; mixing is confusing), and see what you get. By experimenting a bit, you’ll quickly get a feel for it, I reckon.
That was a bit of a confusing explanation on my part: you’re correct here (as far as I’m reading into your words here). I think I was wondering (haven’t tested myself at the moment) whether split_dir also scales the directions by any of these, if you provide its specific file. But I’m now actually pretty sure that’s not the case, or doesn’t matter; so safely ignore. Other than that, there is a useful idea here though: if you want to get a more interactive feel for your threshold(s), either on integral or peak amplitude, you can use -afd or -peak to indeed extract and write these as data files. This allows you to see their values in the fixel tool of the viewer. You can even interactively apply a threshold to any of these values there then, so you can interactively see what the effect of any threshold is. Once you find a good one, you can take note of it, and then apply it properly using the -fmls_integral or -fmls_peak_value options.
If you mean a voxel-image (i.e. a “regular” image) of the AFD (integral) or peak amplitude of the largest fixel, then yes indeed. So as mentioned just above here: you can first extract the relevant metric using either -afd or -peak when performing fod2fixel. Then you can use fixel2voxel: provide it with the relevant data file as input (first argument), and choose the relevant operation as second argument. In this case, that would be max: the maximum of any fixel-wise metric across all fixels in each voxel.
That’s the essence of your question here, I believe? So as I just mentioned then indeed: that would give a voxel image with e.g. the AFD of the “largest” (largest AFD valued) fixel in each voxel. You can just open that up in the viewer, and use any colour scale to show it.
split_data on the other hand would give you the value for all fixels. That might then actually make it harder again to get the one (“largest”) you’d want to show. With max, you can immediately get that value, and no other ones. Does that make sense?
I do indeed see a sudden increase of the number of fixels at the very end of the corticospinal tract and the interface with gray matter. However, I am using msmt csd so I run fod2fixel only on the wm fods. Do you mean that the fixels you’re talking about in gray matter would still be visible for the wm fods as false positives?
Thanks! That seems to work although the maximum afd in this voxel image is different form the one in my entire fixel image when I colour code the latter by afd.mif. Aren’t those supposed to be the same since max extracts the largest afd for every voxel?
The reason why I initially wanted to use the split_data operation is because I want to make a similar afd map for the second and third largest fixel as well. I thought this would be possible through
and then by changing -number to 2 and extracting -coord 3 1 I could get the afd for the second largest fixel. The output from both commands (the one you suggested with max operation and the one I sugegsted with split_data) look similar but differ for some voxels. Could you tell me what the exact difference is between these two commands? Both however show the same maximum afd value which differs form my “total” afd value as mentioned above.
It’s worded a bit confusingly (or my brain is a bit clouded at this late hour )… but so basically, if you see many (3+) fixels in the cortical ribbon, I’d argue several of those are false positives. Increasing the threshold to segment the fixels there, that should be reduced to 2 or even just 1 in many places. However, the possibility to achieve this without in turn losing a lot of true positive fixels in other places, strongly depends on a 3-tissue CSD model, i.e. crucially on the presence of a GM compartment in the model. This compartment then “filters out” the GM signal from the WM FOD, or putting it differently: it “cleans up” the WM FOD, so it doesn’t have so many false positive peaks.
Having said that, this depends also on your data quality and how you went about modelling it of course. I think I didn’t ask that bit yet above though: what is/are your b-value(s), and how many gradient directions do you have for each b-value (and how many b=0 images do you have)?
If you show the relevant “data file” (e.g. afd.mif or other) that is stored in your fixel folder (where there’s also index.mif and directions.mif) in the fixel plot tool in mrview, the values you see there (e.g. via the colour scale) should match for the maximum fixel value in each voxel versus the value you extract via max. Make sure you’re each time talking about / looking at the same fixel “data file” though; i.e. the file you provide tofixel2voxel ..... max ..... should be the same as the one you’re looking at in the fixel plot tool, in terms of “things that match”.
That’s strange; unless we’re somewhere miscommunicating… Is the “some voxels” just a few voxels, or a lot of voxels…? Might be worthwhile to show us both images.
Ok, I’m a bit confused. So they do show the same maximum AFD value? (above I seemed to have understood they didn’t, for a few voxels?). Here you’re mentioning “total” AFD though: do you mean the sum/integral of all AFD in a voxel? That’s something else of course; that’s essentially summing the AFD of all fixels, rather than picking just the maximum one.
So… I’m a bit confused about what you’re seeing that matches, and what you’re seeing that differs between images…
I have a NODDI data set with 97 directions: 8 b0, 27 b1000 and 62 b2500 and I used a reversed PE b0 for distortion correction.
Yes, that’s what I was expecting but somehow the maximum value in the extracted max is lower. I have used a threshold of 0.25 when segmenting fixels. With this threshold, the amount of fixels at the ends of the WM tracts, near the cortical gray matter, were mostly reduced to 1 or 2 or sometimes even 0 without sudden termination of visible ‘fixel’ tracts in the deep WM, like you said. Below are the image, the first one is the afd map shown calculated by your suggested max method and the second onen by using split_data and -coord 3 0. Both images are overlaid with the same fixels as used for calculating the afd maps.
I first compared both methods without thresholding the fixels and then only a few voxels differed; they showed different afd values. When using split_data somehow the lowest afd is 0 although this should be 0.25. I am certain that I’m using the same fixels/afd every time. Does mrview somehow scale the images?
Ah now that makes sense! I thought that the maximum afd (as shown by the colour bar) belongs to one certain fixel in a voxel but if I understand correctly it’s the sum of all fixels in a voxel. Yep that would be more logical of course . I guess you can then ignore my earlier comments on this. Although I still do not understand why the split_data method shows an afd of 0 as the lowest value.
Ok, that should be alright. We’ve recently started to discover and got to the bottom of MSMT-CSD even over-cleaning the WM FOD in some scenarios, including parts of cortical GM. But the bias we’re coming across should (in a weird sense) work “in your favour” here.
So now it’s “just” about picking a good threshold. Putting your earlier statement into this context:
So if you’re seeing that indeed, but with such data and MSMT-CSD, I think you can probably still safely increase the threshold a bit. It’s always a balance, so when false positives disappear, some true positives might go with it still; but I’m guessing that the balance is still in your favour here: there’s an opportunity to get rid of (potentially) loads of false positives near/in the cortex. For your application, as I’ve mentioned somewhere above, I reckon you’d also favour a “clean” fixel segmentation more than an inclusive but potentially messy one.
Ok, not sure this is the correct explanation, but based on your screenshots, I reckon it might have to do with how you “look” at the images. Note that each source (both the fixels as well as the first and the second voxel-wise intensity image) are shown with a different colour scale, i.e. windowing of that scale. A few things of note to get a good grip on this:
When fixel images are opened just like you did (load the index and then colour by the data file; that’s correct!), it sets the windowing (i.e. the min and max limits of the colour bar) to the actual minimum and maximum of the values in the entire fixel image. You can change those manually in the tool’s relevant fields (bottom right in your screen shot), but that’s how they are set by default.
For the main image you load however (i.e. the voxel wise intensity image), it sets the min-max windowing by default only based on the first slice that’s shown when you load it.
The 2 described approaches (either using max operator, or your approach with split_data and the -coord selection) might differ in what they do for voxels that have no fixels in them. Sensible outcomes here would be either ending up with a zero in those voxels, or alternatively with a NaN (not a number) value. However, this will then influence the default windowing, as that doesn’t take into account NaNs, but it does take into account zeros. You can see this happening in your screenshots: the first one windows from a number larger than zero, whereas the second one windows from exactly zero. Also, when interpolation is on (which it is by default, hence the “smooth” quality of the images you see), you can kind of “see” NaN values, as they’re not interpolated. Those are the crisp looking “sharp” edges between the black background and the non-black intensities in the first screenshot.
So putting all that together, I think your perception of the difference between either image might be due to how they’re windowed? You can manually set the windowing of the main loaded image by opening the “view options” tool.
…and this further aligns with that. That “lowest AFD” of zero is all those voxels without fixels (after segmentation). Don’t trust the viewer’s default windowing for this purpose. So manually set the windowing of either of those images to match the other: the images should look quite similar then. Apart from the NaN’s not being interpolated though. I reckon that aspect is the “few different voxels” you were spotting locally. I always prefer to switch interpolation off in any case, because it’s often misleading in several ways about the data you’re looking at. You can switch interpolation of by pressing the i button on your keyboard, or alternatively via the “colour map” menu.
No, we’re getting ourselves into another confusion here. You should instead ignore my comment here: it’s now clear from your explanation that you definitely were not looking at the sum or “total” in any way. That was just a guess, based on your wording of “total …”; but it’s something you would’ve had to do on purpose, not something the viewer would bring up just like that. So to be clear: this is not it. I’m now pretty sure it’s the windowing in the viewer; the key message being: don’t use it as a guide for what is the minimum and maximum in your images. For most loaded “main” images in the viewer, its even only based on the first loaded slice, and not the entire volume.
So I think we’ve got it sorted out now; if all the above makes sense to you of course!
Thank you for the explanation about the viewer, makes things a lot more clear!
Yep, I see now that there are voxels in the afd map that have values that go beyond the maximum intensity shown in the bar.
You mean going even higher than 0.25? A threshold of 0.20 already took care of the false positives near the cortical GM but I increased it to 0.25 just to be sure and because I indeed rather have some false negatives than false positives.
On last question; there are two volumes in the 4th dimension of the max output. The second volume is filled with zero’s but what exactly is this?
No, 0.25 looks good! I hadn’t yet read that part when I was replying to the earlier bits. Your images definitely look sufficiently conservative: no false positives in sight near the cortex at all.
That’s odd. So you only performed fixel2voxel with the max operator, and no other options? In that case, it sounds like a bug in MRtrix. I’d simply ignore the zero-filled volume. I’ll alert the developers, so they can look into it.
Here you go: an issue for the developers to look into. Wait and see!
But in any case, it sounds like you can safely ignore the zero-filled volume; because of all the testing you’ve gone through, it looks like the first volume matches the alternative strategy, as well as the fixels’ data themselves. So I reckon you’re safe!
Update: looks like it’s just waiting for a release. But it’s confirmed to be a bug at least.
I still had a question about how the ‘size’ of fixels are determined by split_data? I was expecting this would be based on the input fixel file you provide to fixel2voxel but apparently it’s not. Meaning; if I provide an afd file to fixel2voxel and extract the afdmaps of the three ‘largest’ fixels via …
… then for the same voxel in all those afdmaps (considering a voxel that has 3 fixels) the afd is not necessarily higher in the peak2 map than the peak3 map. What exactly is it that split_data stores in the 4th dimension? I thought these were the fixels in every voxels based on the afd value…
Ok, just double-checked myself to be certain: you’re right, they’re not at all times guaranteed to be sorted from large to small (I wasn’t aware of that myself when I typed up any of the above!). Other than that though, the extracted values do match the AFD values from the original fixels. But basically, to get what you’re after in the example you provide, you can’t rely on the ordering in which they are stored.
Looking further into the options, I was then (now) thinking you could get this nonetheless by adding the -weighted option to fixel2voxel, and providing that option with the same afd.mif file. The idea here would be that the value you extract (the main argument to the command) is separate from the data that defines the “size” and that the latter would be used for sorting. However, trying that myself, I encountered a warning:
fixel2voxel: [WARNING] Option -weighted has no meaningful interpretation for the operation specified; ignoring
This is strange as there’s also the -number option to limit the extraction to a given (maximum) number of fixels. The documentation of this option reads:
  -number N
     use only the largest N fixels in calculation of the voxel-wise statistic;
     in the case of "split_data" and "split_dir", output only the largest N
     fixels, padding where necessary.
Suggesting at least a notion of sorting (otherwise there’d be no notion of the “largest N fixels”). But while that option does limit the number of extracted fixels, it still doesn’t sort them; probably also implying that its promise of extracting the largest N fixels might be broken (though I haven’t tested that). Finally, I tried to combine -number and -weighted, so as to explicitly introduce the notion of size again, hoping that -number would use it. But alas, the same warning popped up, and the output didn’t sort; so I’m again also left wondering whether the largest N promise holds here…
This is hard to check because most of the time the fixels do come out “almost” sorted. I suppose they just come out in the order they’re stored in the fixel data. That fixel data itself in turn probably gets its ordering just from how the fixels are segmented, but because the algorithm has a few rules about merging or separating individual peaks into single fixels based on relative amplitudes of peaks and valleys, I can imagine the final fixels don’t come out per se in the order the original separate peaks were encountered (e.g. when peaks are merged, I suppose). Lots of supposing and guessing here on my part in this little paragraph… so don’t take it for granted (but it does seem sensible to me in this way). @rsmith can probably help you out with the exact behaviour or hidden/unexpected quirks of fod2fixel followed by fixel2voxel.
However, that aside, the thing I did encounter with the -number not sorting makes me strongly wonder/question whether the “largest N fixels” promise there actually holds in practice, especially when the -weighted is sticking to the warning of not being meaningful for split_data… Even if this does still check out; the documentation could certainly be improved a bit, e.g. to at least mention when sorting can (not) be expected or relied upon. I’ll create another issue to sort out the documentation, or bug if there is one.
I tried the same thing with the -weighted option but surprisingly got the same warning
One thing I know for sure is that the way split_data and the -number option separate different fixels based on their ‘size’ is the same so there must be some logic behind it. It is definitely partially based on the AFD cause in most cases fixel1 shows a higher AFD than fixel2 and 3, just not in all…
Yes, this is what I kind of described (based on some guessing on what feels sensible on my part) in one of those paragraphs above: if my guessing there is right, then this is “just” the order in which they were already stored before fixel2voxel. That order itself, I’m guessing, is naturally quite likely to be not too different from the AFD values, due to how the fod2fixel algorithm operates. But also, due to how it operates, it’s not guaranteed to result in the kind of sorting you’re after (“it just often comes close”). This is, somewhat ironically, the very reason why this should probably be better documented: you have to look pretty closely to release it’s not exactly sorted. If it was 100% random with little to no pattern to it, you’d probably be less likely to assume it might be sorted. Either way, it’s obviously something that can benefit from more explicit documentation / warning.