I’m quite interested in learning more about TOD-based tractography and its application to morphological reconstruction of small fiber bundles. I tried to replicate the TOD pipeline described in Dhollander et al., 2014 on Neuroimage (https://www.sciencedirect.com/science/article/pii/S1053811913012676#f0030) on a random HCP subject so I generated an 80-million streamlines short-track tractogram with same parameters as in the paper (maxlength, minlength, step size, angle etc.) and I got my 0.25 mm resolution short-track TDI for visualization as well. I also generated a normative, non-short-tracks 10-million streamlines tractogram from which I obtained a TDI at same resolution (0.25) to graphically compare effects of short-tracking on TDI contrast details. Then I used the tckmap command with -tod options to obtain first-level TODs from that tractogram. I had the following issues:
When I launch the command tckmap “-template T1w_acpc_dc_restore_brain.nii.gz -vox 0.25 -tod 8 short_tracks_WB_80M.tck WM_TODs.mif” the mapping process starts for a while, then I get the following error message ”Killed: 9”. Is there something wrong? It does the same when I use lmax values higher than 8 or voxel sizes of 0.25. I finally managed to obtain a TOD with voxel size 0.5 and lmax=8 but I’m interested in getting higher resolution and lmax values if possible.
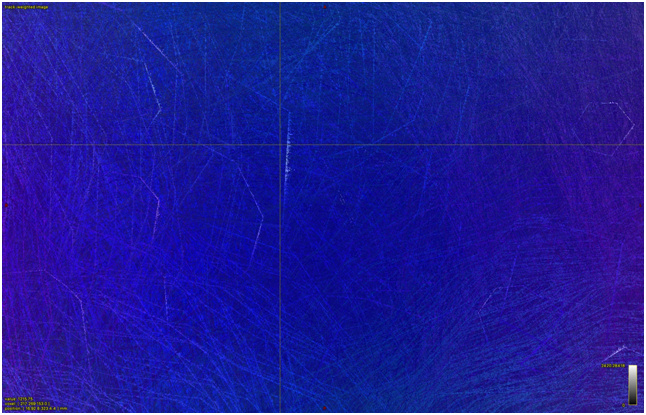
When I open my TOD with ODF display, that’s how it looks like:
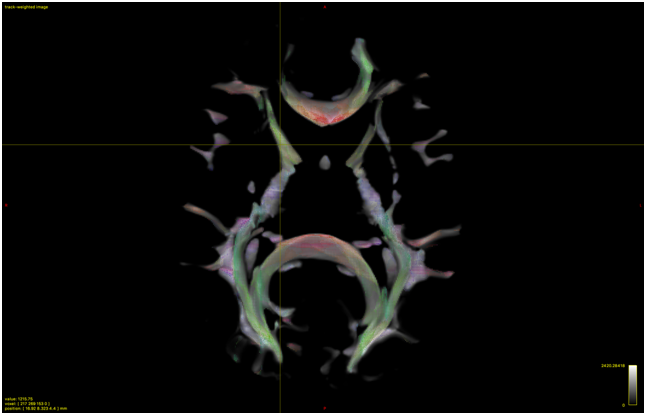
Clearly not that good (but it could nicely work as a mobile phone wallpaper). But if I scale the intensity value to 0.0001:
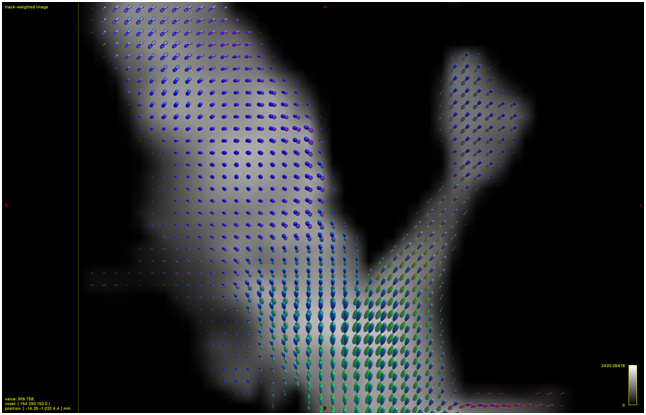
and here with higher magnification:
Looks very better and quite good. I read a similar issue in this post (Tckmap error! how to change the tck header) so I ask just for confirmation: is that normal? Will these TODs work anyway for tractography? And is there some way I can fix this scaling problem for better visualization?
When I open my super-resolved TDIs by simply using the mrview command there is no problem at all (GUI is simply slower, but I suppose it’s normal due to the big file size). But when I try to open my TDIs as overlay on the T1-weighted I get this:
and I just can’t figure out why. The same when I open TDIs using the mrview command but then I try to use the ROI editor tool to manually segment fiber tracts. How can I fix this problem?
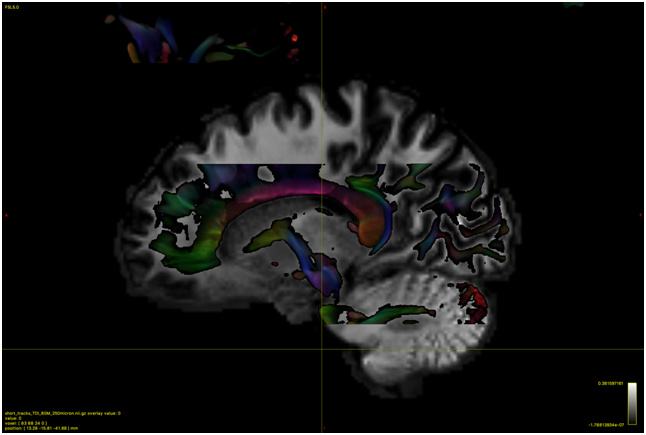
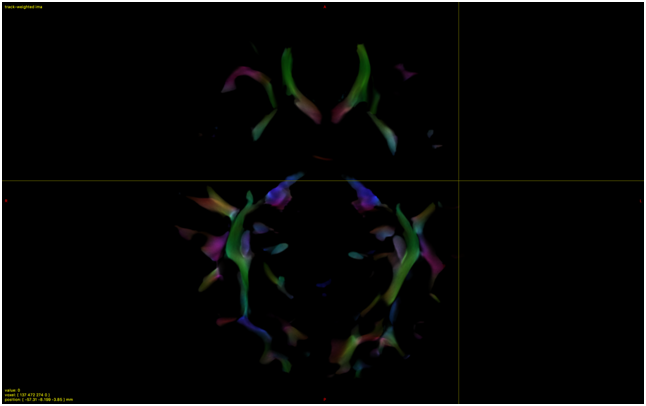
From a qualitative, merely morphological point of view I have the impression that short-track TDI and “traditional” non-short-track TDI are quite different in terms of contrast. Here are some examples of the same anatomical section. With short-tract TDI:
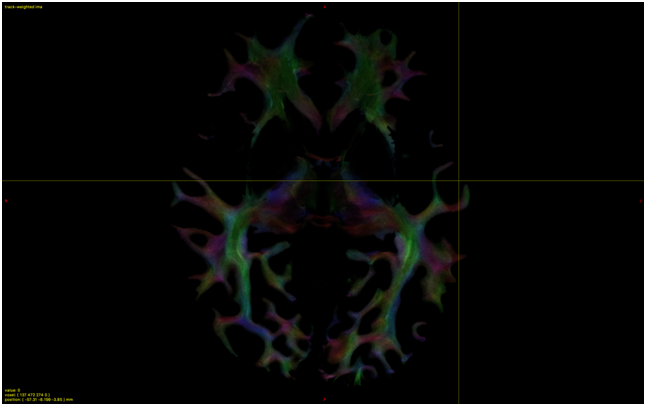
With non-short-track TDI:
Is my short-track TDI good? Looks like short-tracking improves contrast on larger fiber bundles (subcortical WM, optic radiations etc.) but completely underrepresent shorter and smaller bundles (e.g. anterior and posterior commissure or intra-thalamic bundles that are clearly visible in the non-short-track TDI. How this should impact TOD estimation? If I get a whole brain from the TODs estimated from short-track TDI, should I expect underestimation of these small fiber bundles? And eventually, what can I do to preserve the good anatomical contrast of non-short-track TDI when I get TODs? Is there a way to get TODs from non-short-track TDIs (maybe using some other kind of correction for different tract length?).
the mapping process starts for a while, then I get the following error message ”Killed: 9”. Is there something wrong? It does the same when I use lmax values higher than 8 or voxel sizes of 0.25.
This is probably a memory issue. Normally you’d get an error message like “Unable to allocate memory”; “Killed: 9” suggests there is some kind of job scheduler or watchdog that is actively killing the process. If there is a limit being imposed that is lower than the total physically available memory, you’d need to investigate that yourself as it is independent of MRtrix3. But keep in mind that you have 45 coefficients per image voxel, so memory consumption is going to be large. One way to decrease memory usage slightly is to either not use a template image, or crop the template image to remove empty space around the brain.
When I open my TOD with ODF display, that’s how it looks like:
But if I scale the intensity value to 0.0001:
Will these TODs work anyway for tractography? And is there some way I can fix this scaling problem for better visualization?
The ODF overlay defaults are tuned for displaying conventional FODs. There has to be some translation between FOD amplitudes in arbitrary units, and mm. If the TOD amplitudes are based on streamline count, then any voxel with more than a few streamlines is going to be intrinsically larger in magnitude than FODs estimated from CSD. Ideally the ODF tool would look at the intensities present in the input image, and derive an appropriate scaling factor based on that; this is on the todo list, but it’s currently a long list.
If you know a priori or can derive an appropriate scaling factor yourself, you could multiply the ODF image by that factor, and then the scaling factor in the ODF tool would not need to be so extreme. The relevant manuscript mentions that some form of intensity normalisation is necessary if the data are to be visualised with other data and/or used in an iterative fashion. For instance the threshold for tractography is applied based on an absolute value, so if the underlying values are orders of magnitude larger than the data on which that threshold has been tuned, its impact on tractography is likely to be very different.
But when I try to open my TDIs as overlay on the T1-weighted I get this:
That is an unusual one. I’d suggest starting with TODs at smaller resolution, make sure they are displayed OK, and then increase the resolution until the problem appears. The difference in either file size or image dimensions when the problem arises should provide some insight.
Hi @Gianpbas, thanks for your interest in TOD-based tractography! First thing to take into account is that that work was done using quite an ancient version of all relevant code, so don’t per se force yourself to use exactly those parameters. There’s mostly 1 crucial bit: it’s got to be “short-tracks” tractography to generate the TOD. So max. length is a crucial parameter to impose manually. Min. length, on the other hand, can manipulate how much “track-like local support” (“TLS” in the manuscript) is needed for structure to be taken seriously, and thus be represented by a peak/lobe in the TOD. I hope that doesn’t require much explanation to understand…? Finally, as always with any sort of tractography, you might want to pay close attention to the -cutoff option.
About this bit:
So a few things about either the spatial resolution for the TODI step or TOD image; and then some about short-tracks vs long-tracks (“non-short-tracks”). Upping the spatial resolution can be neat for a visualisation, but for TOD-based tractography itself, I strongly recommend against it. TOD-based tractography works most effectively if the original resolution (or an isotropic resolution close to it) is retained. In that way, each local TOD gathers a more robust and complete sampling of the “TLS” of its surroundings. Finally, “TLS” is defined to be the result of short-tracks tractography in particular: long-tracks (“non-short-tracks” or lets say just “tracks” ) out of the box is affected by a seeding or tract (bundle) length bias, depending on how you word the thing: basically, longer bundles get more seeds, for which lots of streamlines run most of the length. So there’s a (strong) “bias” for long bundles to have far more streamlines. TLS, however, isn’t concerned with length, but indeed just with track-like local support. Due to what information comes together in a local short-tracks TOD, you can also think of it as it’s more immediate surroundings along streamline trajectories boosting its TOD lobes volume. We don’t want longer distances to bias it further upwards. Other than that, over longer distances, all the issues with false positive connections start to show up all over the place as well, so anything depending on that quickly becomes biologically nonsensical.
So likely memory concerns… If you’re just after this for a visualisation of a particular slice, you can always even crop the template image even all the way down to a single slice. However much (or less) you crop will depend on how far you can push it with memory constraints, but some kind of cropping might be necessary to generate a certain spatial resolution. Note that this can sometimes surprisingly escalate in 3D: e.g. upping resolution by a factor 2 along every dimension, means generating 8 times as much voxels / data / stuff requiring some memory space.
Well, the world needs phone wallpapers too, so that’s something. No, all kidding aside, this is in a way actually entirely correct and fully “intended”. The units of a TOD are streamline counts, which easily grown in the thousands, ten thousands, …etc… when generating 80 million short tracks. The ODF display tool in mrview is by default “calibrated” for FODs, whose amplitudes are in most typical scenarios around 1 (can vary below but also above that, but it’s not e.g. 10 or 100 or something). You can have lengthy discussion whether the viewer should do some automatic scaling or something when opening an image, but at the moment, it doesn’t. So TODs like these are simply several orders of magnitude larger than your typical FOD. So in terms of “fixing” this for the visualisation: that’s exactly why the scaling value/box is there in that tool. The fix is, well, rescaling.
For tractography, you need to just reason about a different order of magnitude as well. This directly impacts the -cutoff option to tckgen. This will always have to be set to a value that’s also at least a few orders of magnitude larger than the default value, for the same reasons as above (the default value was chosen for most FOD scenarios, not TOD scenarios). There’s no general “default” value here, as it’ll depend on how many short tracks you generate, the voxel size of the TOD image (larger voxels accumulate larger track counts and thus larger TOD amplitudes), the track min/max length, etc… If you do want to figure out a good starting point though, the viewer’s scaling option can give you a clue here: if you need to scale e.g. by 0.0001 to get things to visualise more akin to the size of FODs, you’ll need to change the -cutoff similarly (e.g. in this case multiply the default value of -cutoff by 10,000). But as always with anything to do with tractography: look at your results. Look at the TOD to see whether it represents the features you want to track. If not, change the short-tracks tractography’s parameters accordingly. Once the TOD is fine, perform your TOD-based tractography as described here, and look once more at the results. Are you missing some features? Lower the TOD -cutoff. Are you tracking too much randomness? Increase the TOD -cutoff.
Weird.
Not even TODs, so it seems, just the TDI image (well, DEC TDI). I’m a bit baffled they open well as main image, but this particular problem pops up when loaded as an overlay. Looks like an mrview bug to me; but indeed likely related to the size of the image… that’s the only “unique” aspect I can see in this scenario.
Yep, absolutely. See my description above. One of the original TDI-related papers explains some of this as well. But essentially, non-short-track TDIs will show longer tracks with (relatively speaking) far far higher intensity. That’s also what you see in your second screenshot: the brighter things are part of longer tracts, or artificially long tracts due to typical points in human anatomy where false positive turns or trajectories are taken by tractography. This is a contrast that can’t really be well described to relied upon for those reasons: too many effects, both biological as well as artificial, getting mixed up and coming together in the final results. The short-tracks TDI / TOD is in that regard a bit “better controlled” in a certain way, which is why I tried to describe the amplitude of the short-tracks TOD in the paper as the track-like local support (TLS) concept. There’s an intuition to it, where surrounding track-like structure gets a more fair / equal / … chance to contribute to the TLS for given orientations of the TOD. So it’s a metric of presence of track-like structure; the “presence” being defined by the initial short-tracks tractography parameters; i.e. the first tractography defines the criteria of what is regarded as “track-like”.
I would lower the -cutoff maybe, or maybe (also) lower the min track length. At first sight, it looks like you’re still missing quite a few structures, hinting that the short-tracks tractography parameters were too strict.
Well, in your output, yes. But it shouldn’t be like that: see my comment right above this one. Compared to the long-tracks (“non-short-tracks”), you should really only introduce a max. track length, and leave the other parameters unchanged. I’ve got the feeling either the -cutoff or the min. track length was increased. This is the result based of the initial FOD-based tractography, right? If this is already TOD-based tractography, you need to tune -cutoffdifferently.
Nope, it shows the parameters weren’t set correctly (as above). But when explaining, always be clear what stage of tractography you’re talking about. The confusing wording here is “TODs estimated from short-track TDI”: that technically doesn’t exist. I suppose you’re talking about TODs estimated from short-track FOD-based tractography? In that case, just tweak the FOD-based tractography parameters better. Go with the current defaults in MRtrix to start with, and just introduce a max. lengths on top of that to obtain a decent short-tracks tractogram. Don’t try to get those old numbers from the paper into the newer version(s) of MRtrix: MRtrix’ behaviour on that front has changed too many times to keep track (no pun intended) of. Definitely think of short-tracks tractography like that (without further mysteries): it’s regular tractography, with mainly a max. length imposed. The other parameters can be tweaked from their default values as well, but don’t have to be set to fundamentally new values. That’s all on FODs, and gives you then a short-tracks tractogram. The short-tracks tractogram becomes the (“short tracks”) TOD. Tracking on the TOD requires drastic modification of the -cutoff because it has a very different order of magnitude (as explained above).
Not possible; see above. Don’t use non-short-track tractography as a source to generate TODs intended to be used for TOD-based tractography. As mentioned above, this was the motivation for the definition of the TLS metric (requiring short-tracks tractography to generate TODs).
Hehe, well, the appropriate correction you’re thinking of is to impose a max. track length during tractography… upon which you end up with short-tracks. But as mentioned above, don’t change other parameters at the FOD tracking stage. Between your screenshots, those must have been changed, because of the structures there were überhaupt tracked.
Sorry I don’t have more time to generate a full blown example now (I might have some time in the new year…); but using HCP data, you should be able to get pretty brilliant results, representing everything from large to very small bundles quite well. If I find some time at some point, I might put up a little tutorial online, using HCP or other publicly available data.
…hope this helps already a bit. (and isn’t too long of a read ).