Thank you Rob,
The problem was solved:slight_smile:
The SH based TOD image is quite normal seen from the first coefficient. However, when I load it as SH image in ODF view, it looks strange.
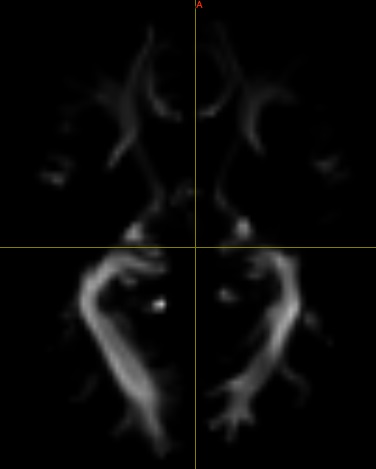
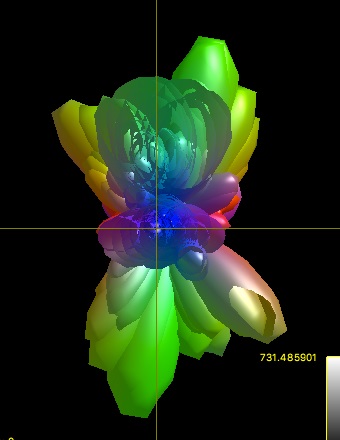
The intensity range of the TOD SH coefficients is much larger than the FOD SH coefficients. I am wondering are there any guidelines for TOD visualization and implementing the TOD tractography?
Thank you very much!
Ting