Thank you for your informative response.
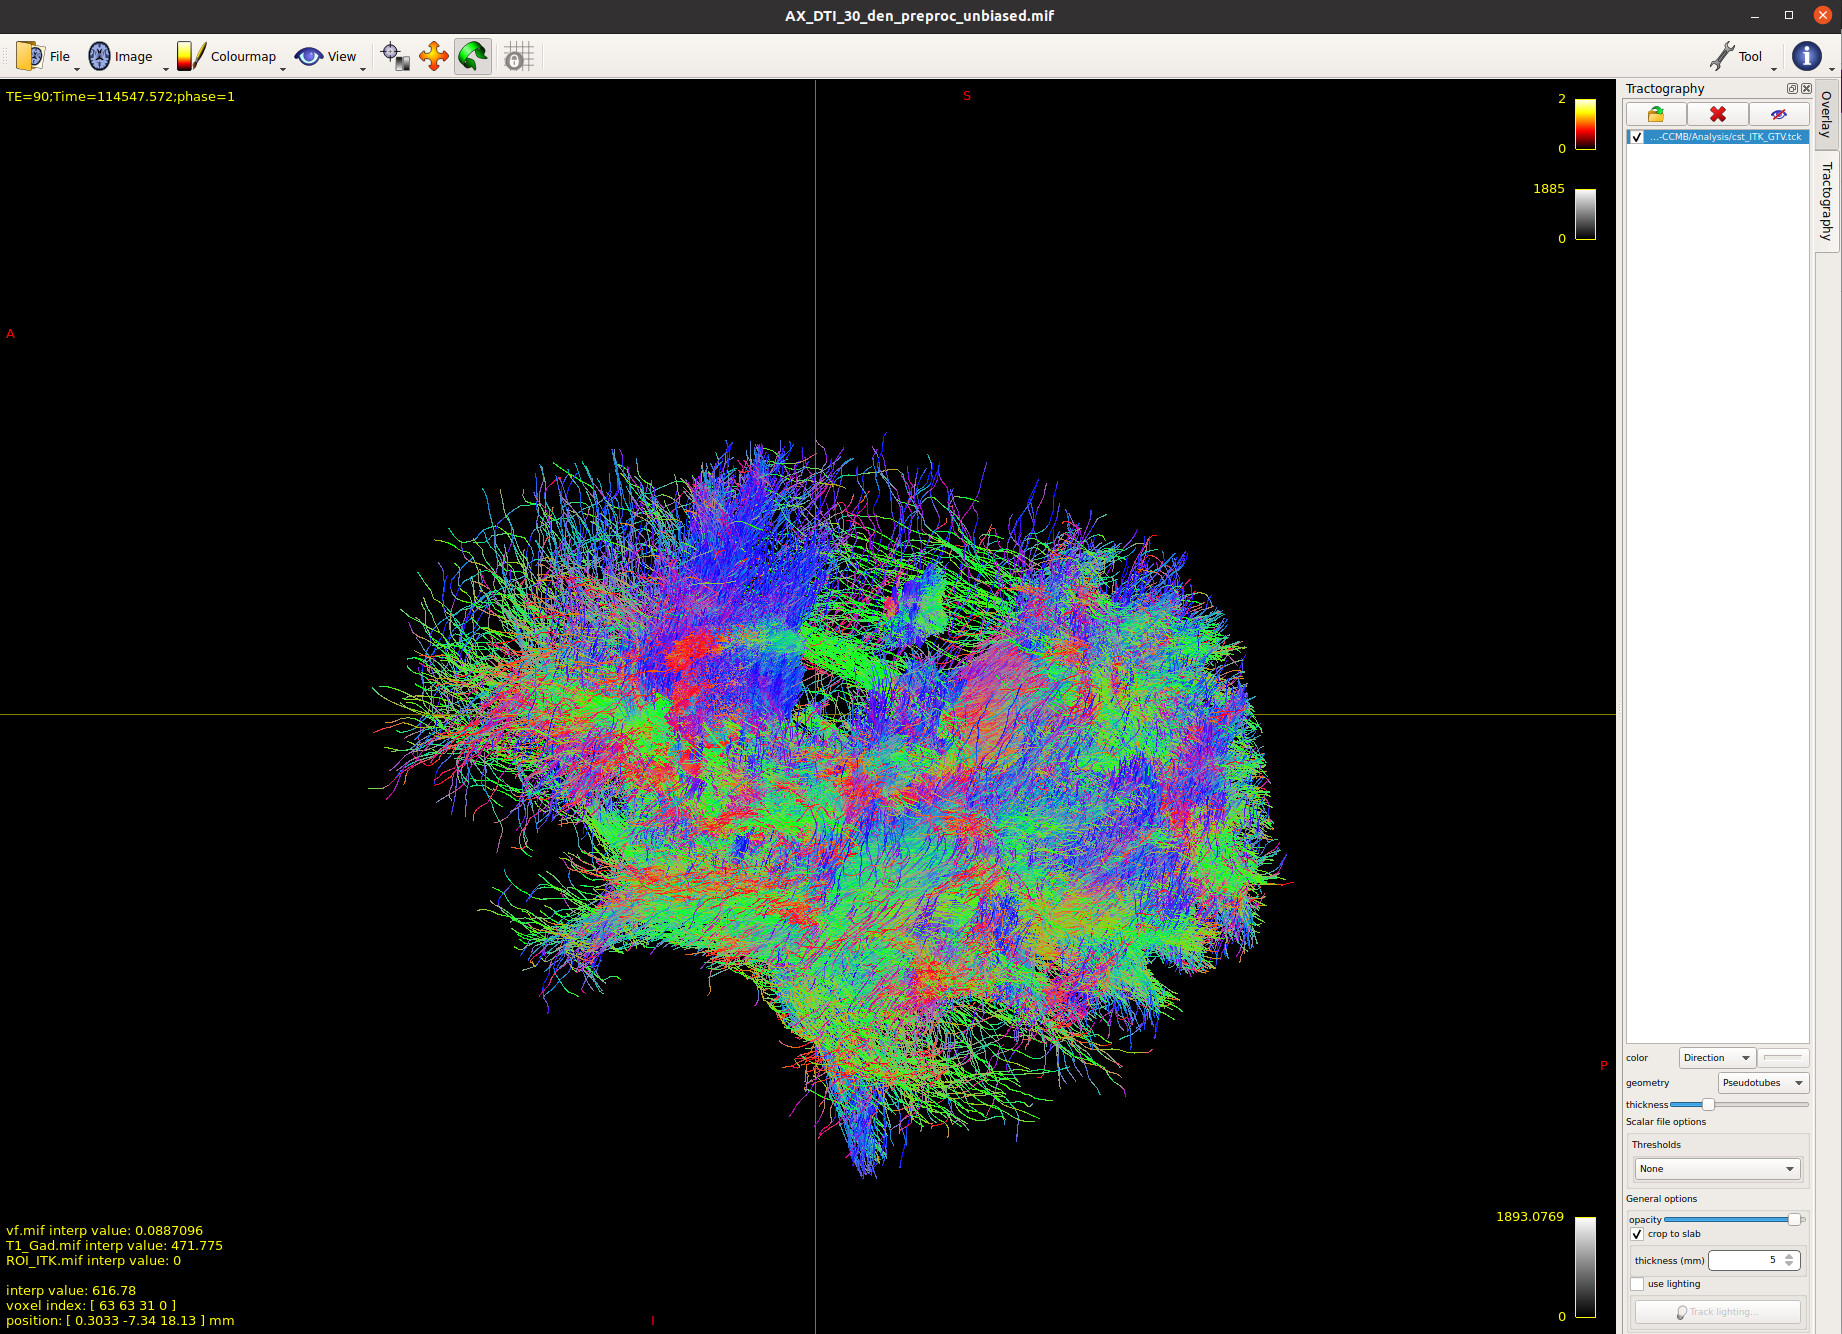
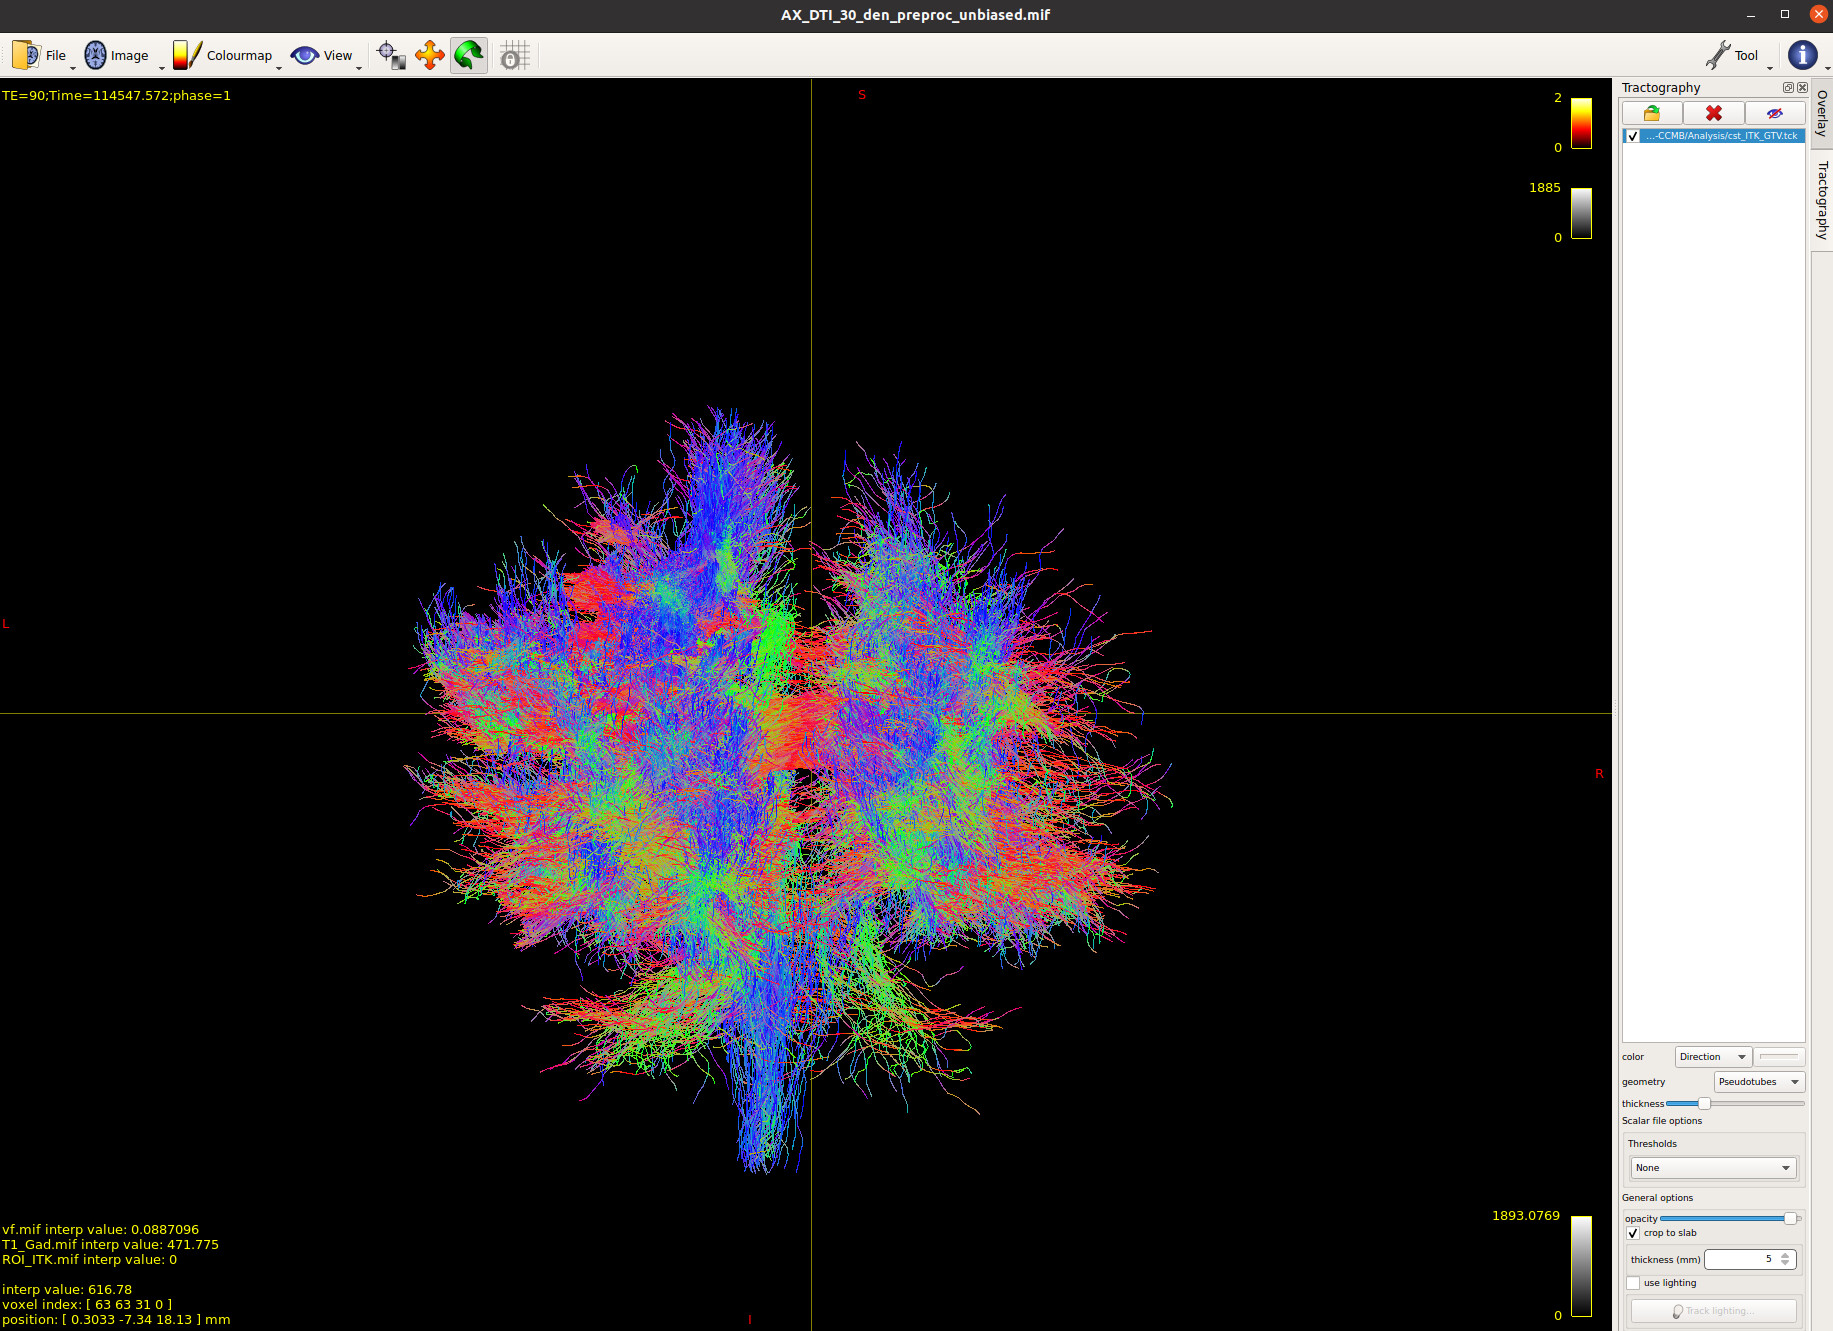
I could successfully reconstruct fiber tracts. Overall, it looks great. However, I see sometimes fiber tracts are crossing the tumour. I was wondering why this is the case. In fact I am filtering the fibers only to the region of interest. In this case, I have used ITK-Snap to segment the Tumour, then I used that information in MRTrix and filtered fibers to the tumour. Surprisingly, I see many fibers (my expectation was to see much less since we are expecting not to see many fibers crossing the tumour). I have attached images for your review. I have overlaid, FOD, T1-Post GAD, DTI, ROI and Fiber tracts to further investigate the result.
I’ve moved your reply to a new thread, since the content differs drastically from the title of the original thread, which makes it harder to find for other readers for which the information might be relevant.
It’s not uncommon to have infiltrating tumours that both genuinely have axons passing through them, and have enough diffusion restriction and resulting FOD amplitudes to support reconstruction of streamlines through them. Indeed in some cases it is precisely this kind of result that can inform presurgical classification of tumour and treatment strategies. So in the absence of any other information I don’t think that this is something to be “concerned” about.
Imagine the following scenario. You take a healthy brain FOD image, and manually draw a region of interest in the white matter to act as a simulated lesion. Within the voxels of that “lesion”, you multiply the FOD magnitudes by, let’s say, 0.1. Now the FODs are way smaller than they are in the rest of the WM, but let’s say that they’re still just large enough to exceed the FOD amplitude threshold applied by the tractography algorithm. The results of tractography on this modified image will be almost identical to those obtained on the original, unmodified image. Why? Because (ignoring the more esoteric caveats) streamlines tractography doesn’t actually care about the size of the WM FOD; all it cares about is whether or not that amplitude is or is not above the threshold used for termination. So 1) As long as the FODs are above threshold, you will get streamlines; 2) the number of streamlines should not be used as a proxy for the density of axons.
Where it gets even more interesting, is if you actually do want to try to apply any kind of interpretation to the number of streamlines crossing the tumour, as opposed to a binary presence / absence of such:
Surprisingly, I see many fibers (my expectation was to see much less since we are expecting not to see many fibers crossing the tumour).
If you have “filtered” (i.e. “selected”) only those streamlines that intersect the tumour, then that absolute number of streamlines only makes any sense relative to the total number of streamlines generated over the entire brain; and even then, interpretation is limited to “the fraction of whole-brain streamlines that cross the tumour”. So how much further I would need to go with this discussion depends on whether or not you are using “many / less” as a substitute for “some / none”, or whether you are in fact interested in something quantitative reflecting an estimate of the density of axons that pass through the tumour region. That requires the incorporation of fibre density information, which naive streamlines tractography does not do. Some of the relevant methods for doing so are referred to as “filtering”, despite the fact that they’re doing something entirely different to what you had described earlier using the same term, hence the prior scare quotes. Then there’s the issue of the prospect of axonal truncation within tumours, for which I refer to this work.
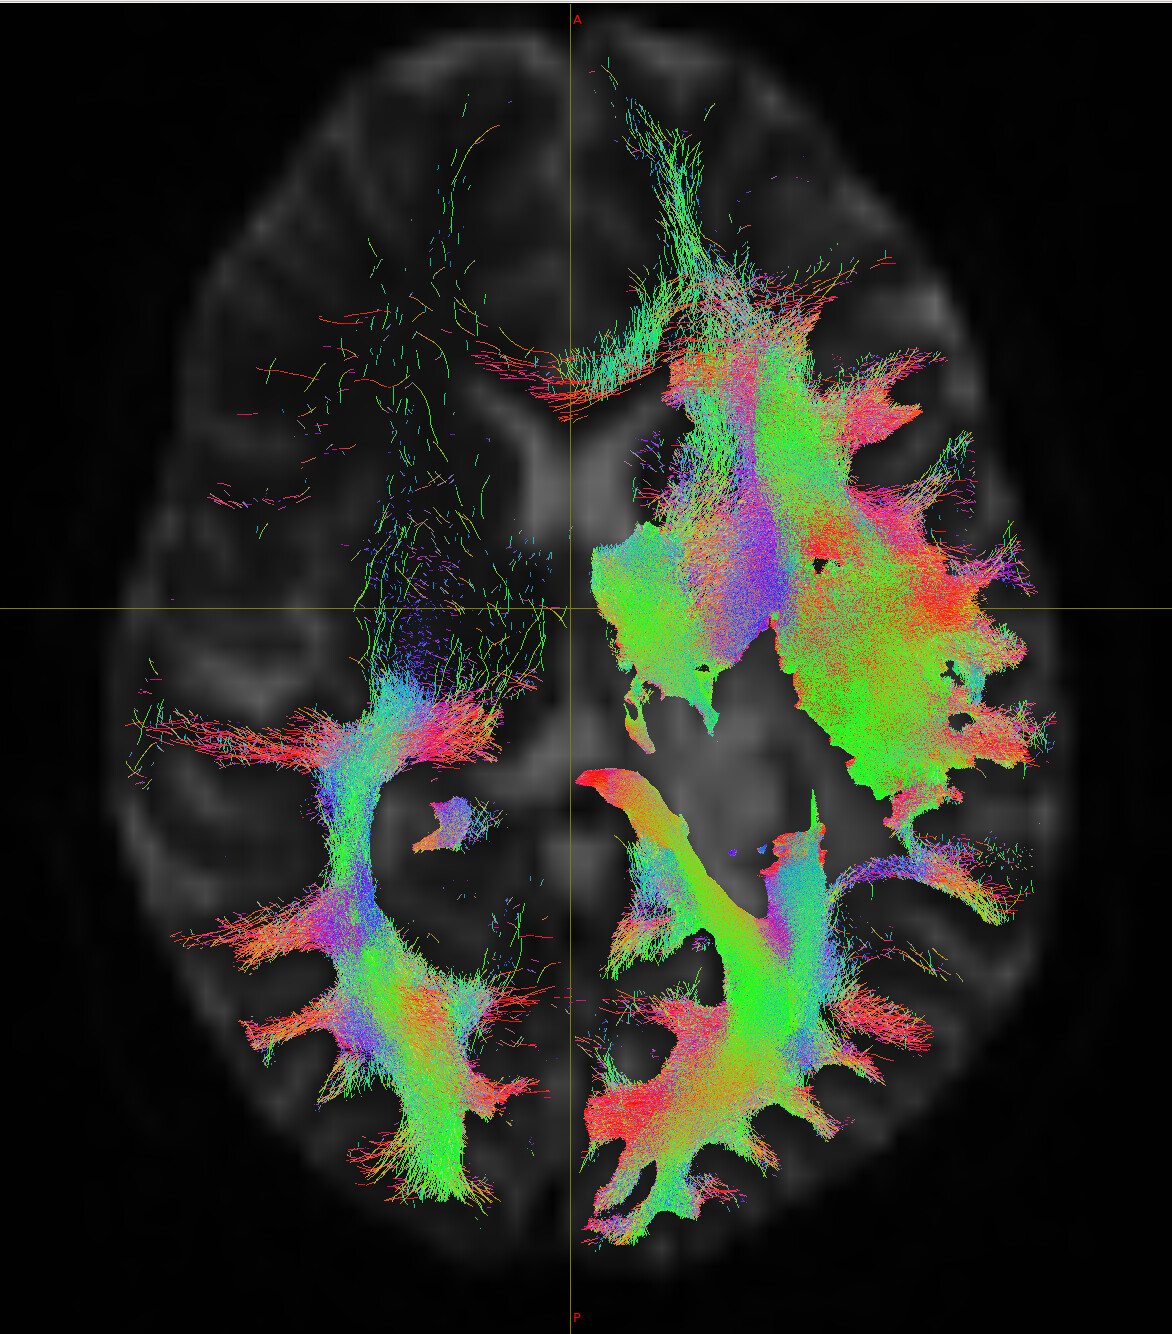
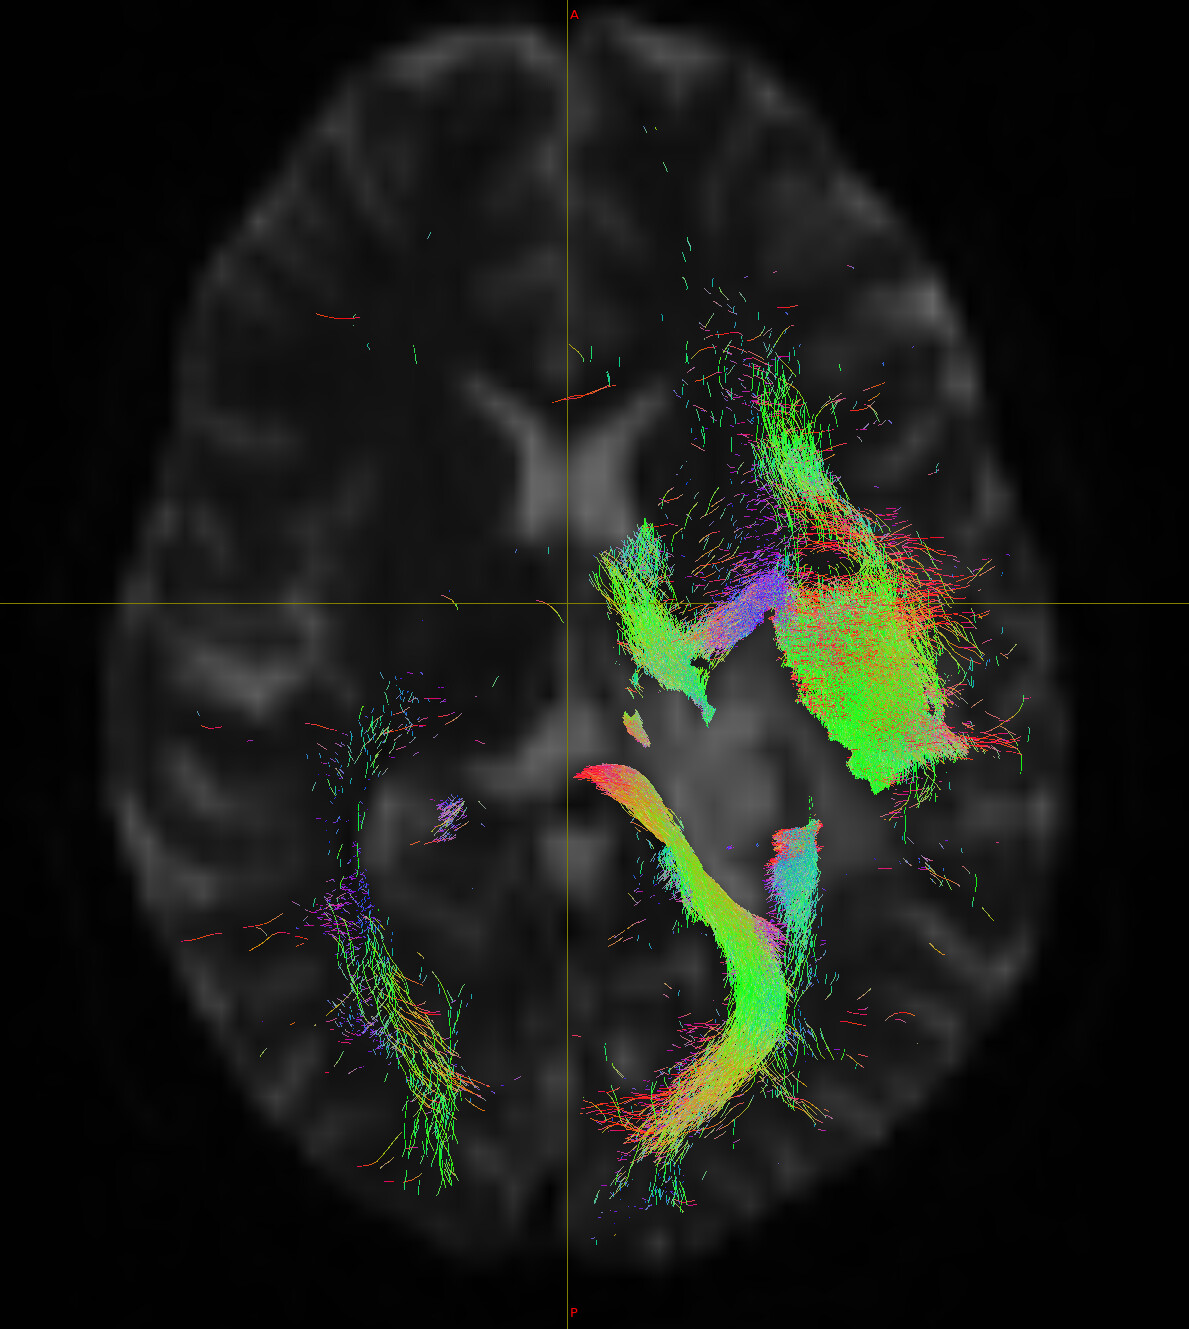
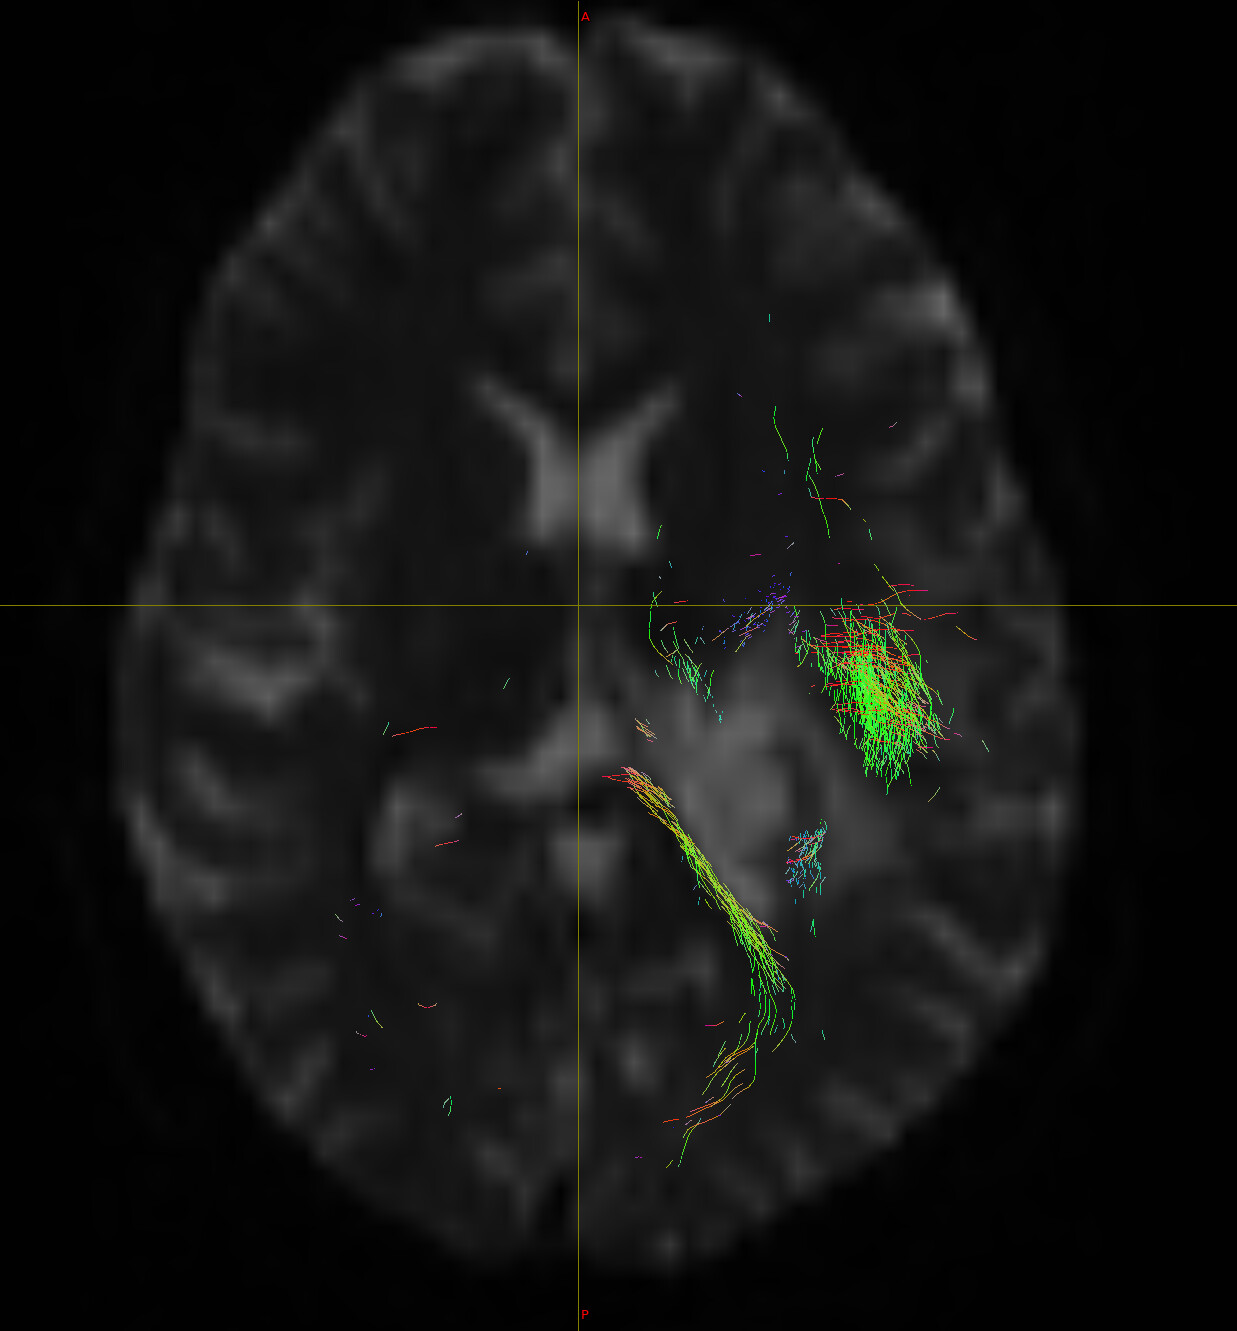
I was wondering whether you could assist me in understanding my results better. I have generated 10 M streamlines using tckgen and seed ROI. I used the following line of code:
Then I used tckedit to view smaller number of tracts, e.g. 200k and 3k. Surprisingly, I see totally different results when I compare them to one another. By looking at the same slice, could you help me understand why am I getting different results and find out the logic behind it (i.e. no tracts in 200 k and 3k in some regions, while the result of 10 M shows tracts at the same location). I am not sure which one is reliable for further analysis. I have attached images for your review. Thank you for your time.
It’s not immediately clear to me the nature of the concern. The results between the three images are basically what I’d expect for your experiment.
One way to think about it is that there’s an infinite set of all possible streamlines trajectories, and we only ever reconstruct & visualise a subset of them. If your subset is finite but nevertheless still very large, what you see will be a reasonable depiction of that infinite set. Whereas if your subset is very small, there’s a good chance that there will be areas that are traversed in the hypothetical infinite set that are not traversed in your small subsample, simply because the size of that subsample is not adequate to faithfully represent the total extent of the infinite set.
I think perhaps some of the confusion might arise from saturation of the visualisation. When the streamlines are few and thin, you can see the gaps between the streamlines, and it is these gaps that give a perception of density. However once you have enough streamlines in an area such that there are no longer any pixels that aren’t traversed by at least one streamline, it becomes impossible to judge how many streamlines are actually there. So you may be looking at the 10M image and thinking “this has finished reconstructing those pathways already reconstructed with 200k, and is now traversing other areas; why doesn’t the 200k also traverse those areas?”. The better way to think about it is “the 200k image is just a less dense version of the 10M image; but in some areas, even the 200k image is fully saturated, and therefore I can’t see any difference in those areas even if I increase all the way to 10M”.
One thing you could play with in tckedit is the -skip option. So instead of just selecting the first 200k streamlines, you grab streamlines 200,001 - 400,000, 400,001 - 600,000, and so on; and then flick between them in the viewer and see the differences. Those differences aren’t biological; they instead communicate the imprecision in the reconstruction for that particular streamline count.
So:
I am not sure which one is reliable for further analysis.
“Reliable” is unfortunately a bit open to interpretation, but I would pose it this way: If more streamlines = more precision (/ less intrinsic variance), and you have a large tractogram generated, for what reason would you use any fewer streamlines than the full set? The only reasons that come to me are: 1) Visualisation; 2) Actually interrogating the imprecision of the experiment by using multiple independent subsets of the tractogram.