Due to issues with MPRAGE contrasts, I’ve decided to perform my tracking without ACT, and proceed onto keeping a WM segmentation as my tracking mask.
To ensure the successful seeds (I am still using the dynamic seed option) are homogeneously placed throughout the brain - and to also satisfy my curiosity - I was wondering if there was a simple code to visualise these seed points?
I’ve extracted the floating points obviously with the -output_seeds option in tckgen, but I have no idea to create the subsequent image, as per Smith et al . (2015) below:
I asked the same few months ago, this is the answer that @rsmith gave me:
Figure 6 is the easy one. That’s basically a TDI, but where only the endpoints contribute to the density image rather than the entire track. You can achieve that using tckmap with the -ends_only option.
So the image copied from the ACT paper is of the density of streamlines terminations, not the seed points: that’s fairly easily generated using tckmap -ends_only. A map of the seed points is slightly trickier, since both the code and the file format are largely designed around ignoring which point along the track was the seed point.
A couple of options:
Since you’re specifically using dynamic seeding, you could try un-commenting this line and re-compiling. (Hopefully it still works; trouble with #ifdef'd code is that it can go out of date…). That should give you some fixel output images, and some extra terminal output.
For anything other than dynamic seeding, you can use tckgen -algorithm seedtest to generate a track file where each track only contains one point, corresponding to the location of a seed point.
If you specifically want the seed points corresponding to a particular generated tractogram, then some trickery will be required. My suggestion if you want to give this a go (no idea if it’ll work):
Use the -output_seeds option in tckgen
Parse the 3-vector corresponding to the real-space position of each seed point
Use tckconvert to convert this from ASCII to a .tck file - will probably come out as a single file containing a single track, where each point is a streamline seed point
Use tckmap, with the option -upsample 1 so that no interpolation of the ‘track’ is performed between seed points.
Posting my implementation of Rob’s suggestion here, in case anyone comes looking for this question again.
I skip the tckmap step, as I just want to visualise the successful seeds as dots in mrview and you can do that using -tractography.geometry points
# Run tractography and keep successful seed coordinates
tckgen fod.mif -seed_image seed_roi.mif -output_seeds seeds.txt out.tck
# The output seed file contains two comment lines and two leading columns we don't want
tail +3 seeds.txt | cut -d "," -f 3- > parsed_seeds.txt
# Create a tck file: each seed is now one point on a single "track"
tckconvert parsed_seeds.txt seeds.tck
# View result
mrview t1.nii.gz -tracktography.load seeds.tck -tractography.geometry points -roi.load seed_roi.mif
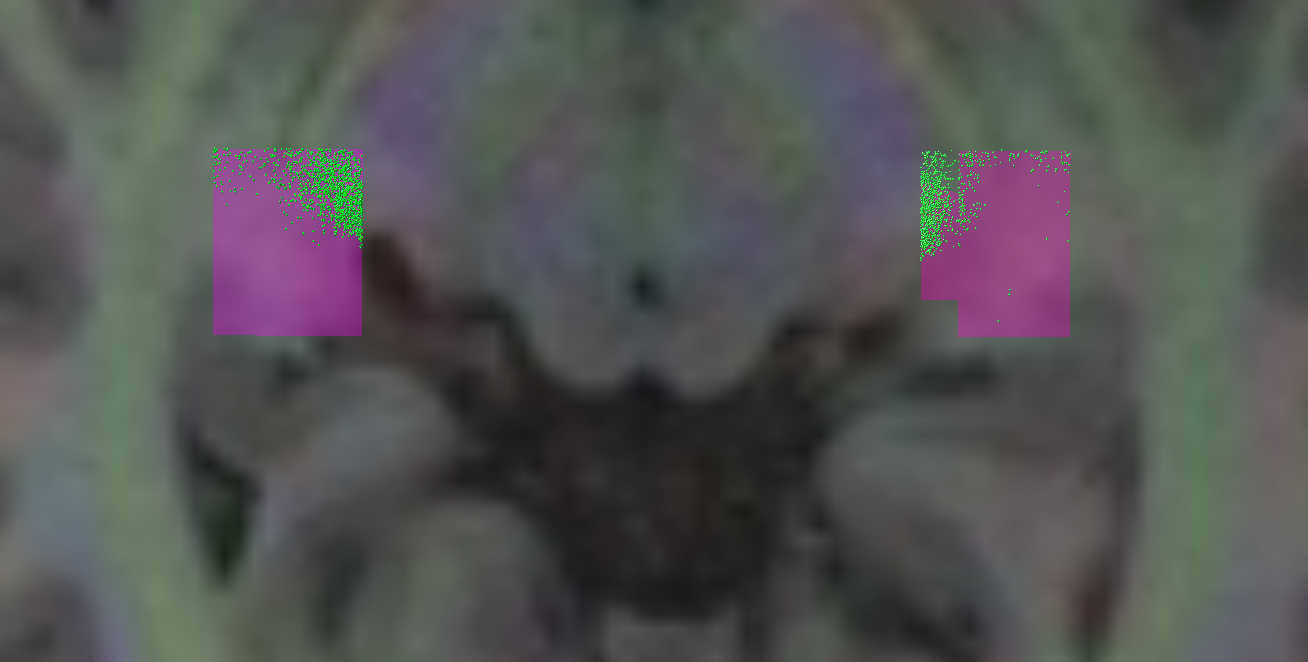
Then I get this nice image showing me how bad my ROI placement is!
I’m sure I’ve read how to do this somewhere else on this forum before, but I cannot for the life of me find the relevant post! So apologies if this is a repetition
Hi Fiona,
Thank you for this helpful post!
When running tckconvert parsed_seeds.txt seeds.tck on my text file containing the seed coordinates, I always receive the error message Segmentation fault (core dumped).
Did you encounter the same issue? It seems like tckconvert cannot read the input .txt file correctly. Do you have any ideas how to fix this?
Thank you,
Franziska