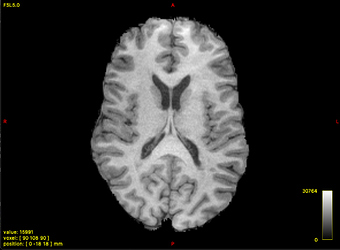
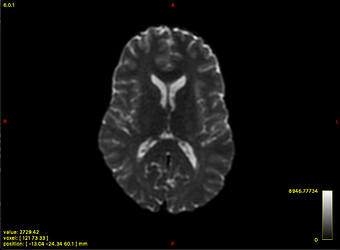
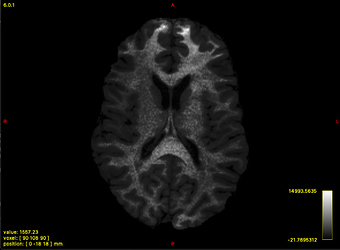
No, I’m not surprised, I’ve seen exactly that before. There is no good one-to-one mapping in that case. Sometimes it might get a bit closer (as probably did in that paper), but most of the time this is off way to much to be useful. We noticed this in our lab as well, when we desperately needed a solution for this work: Fibre-specific white matter reductions in Alzheimer’s disease and mild cognitive impairment | Brain | Oxford Academic , and even more so the follow up work (where lesions needed to align accurately between T1, FLAIR and dMRI data): https://www.biorxiv.org/content/10.1101/623124v1.full .
We ended up with a fully working solution that’s based on this mechanism to produce a T1-like contrast (this will greatly add to your web-lurking attempt to find answers  ): https://www.researchgate.net/publication/307862882_Generating_a_T1-like_contrast_using_3-tissue_constrained_spherical_deconvolution_results_from_single-shell_or_multi-shell_diffusion_MR_data .
Internally, Rami and myself developed an integrated solution to estimate, and re-estimate, this T1-like contrast during iterations of registration (with outlier rejection, etc…). This worked perfectly well with our data, even with large volumes of white matter lesions (their contrast was estimated correctly too).
However! (buzz-kill follows)
For this to work well with the current registration in MRtrix (which we used at the time), key being that this is currently limited to squared-difference based registration that aims for exactly matching intensities, you’ll need decent bias field correction for the T1w image. This is by the way also partially what causes issues for the other strategy in the results you show; but it’s more complicated there.
Therefore, it’s not robust at all times; I’ve seen it work on some datasets, and perform sub-optimally on others. It’s not always easy to inspect the result, so it’s hard for the average user to identify when it works sub-optimally. So I find it a bit too risky at the moment to just put out there as an integrated solution; people might get inaccurate results and not even realise it.
What I recommend if you want to give something like this a shot in any case is roughly this:
- Make sure you run some form of bias field correction on the T1w image (ANTs’ N4 algorithm is good for this)
- Run a form of 3-tissue CSD on your dMRI data. You can go with MSMT-CSD if you’ve got multi-shell data. SS3T-CSD should do the job for single-shell data most of the time. If you need SS3T-CSD, it’s available at https://3Tissue.github.io .
- Once you’ve got a bias field corrected T1w image and 3-tissue maps, make sure they’re at least already reasonably rigidly aligned; so there’s a lot of (correct / accurate) overlap between all relevant tissues (WM - GM - CSF). You can use e.g. FSL’s FLIRT with a normalised mutual information metric for this.
- Extract the WM map from the WM FOD volume (
mrconvert wmfod.mif wm.mif -coord 3 0). The GM and CSF from 3-tissue CSD techniques are already “just” maps out of the box.
From here on, follow essentially the steps (as shown in the images) in https://www.researchgate.net/publication/307862882_Generating_a_T1-like_contrast_using_3-tissue_constrained_spherical_deconvolution_results_from_single-shell_or_multi-shell_diffusion_MR_data (A-B-C-D-E below match with the image in the abstract):
A. Bias field corrected T1w image; you got this from the steps above.
B. Resample the aligned T1w image to the grid of your diffusion data / 3-tissue CSD result. This might have already been done “automatically” for you if you used e.g. FSL tools to register. Then apply the brain mask you used for your dMRI data. Everything now “lives” on the same grid.
C. 3-tissue CSD result, you got this now as individual tissue maps (GM and CSD directly from 3-tissue CSD, WM from the command above extracted from WM FOD).
D. Normalise to sum to one for each tissue map / compartment. You effectively get tissue signal fractions then, a useful piece of information for many subsequent analyses. You can e.g. do this per tissue type via mrcalc (assuming wm.mif is only a map, see above):
mrcalc mask.mif wm.mif wm.mif gm.mif csf.mif -add -add -divide 0 -if frac_wm.mif
mrcalc mask.mif gm.mif wm.mif gm.mif csf.mif -add -add -divide 0 -if frac_gm.mif
mrcalc mask.mif csf.mif wm.mif gm.mif csf.mif -add -add -divide 0 -if frac_csf.mif
E. Fit the T1w intensities (on the dMRI grid, see above) as a linear combination of these 3 tissue signal fraction maps. The easiest way to do this in any external software (e.g. MATLAB, R, …) is to use mrdump with -mask mask.mif on each of the frac_....mif images above separately (so run it 3 times), and then also on the regridded T1w image. This will give you 3+1 text files, will all intensities in all those images stored in the same matching order. Import this e.g. in MATLAB, and run a least squares estimation with 3 unknowns and as many equations as there are voxels in the mask (i.e. a massive number typically). Do check all input text files first for non-physical or non-finite values such as NaN or Inf (various steps might introduce these). If they exist, remove the entire equation from the system, i.e. the corresponding entries for each of the 4 text files / vectors at this point.
Finally, once you got the 3 weights, use mrcalc to multiply each with the fraction image and sum, as follows:
mrcalc frac_wm.mif WM-WEIGHT-HERE -mult frac_gm.mif GM-WEIGHT-HERE -mult frac_csf.mif CSF-WEIGHT-HERE -mult -add simulated_T1w_contrast.mif
The final image should resemble your bias field corrected / regridded T1w image closely, similar to figures B and E in the abstract.
As mentioned, even when it closely resembles this successfully, I think I would still not recommend sum or squared differences guided registration: if the intensities are even ever so slightly off, registration can very easily be misguided. At this stage, I’d use the resulting contrast e.g. with FSL FLIRT and in this case normalised cross-correlation as the guiding metric. Set it as such that you’re only after a very, very smooth warp (even when these distortions are large, they’re still relatively smooth in space). Get the warp from FLIRT, get it into MRtrix, apply to the WM FOD image and GM and CSF compartments if you need them.
That explanation got longer than I intended to… 

It looks more complicated than it is in practice, but you’ll need some confidence chaining a few tools together, as you notice. I wrote that abstract and generated the results all at once in less than a day; if that can aid confidence (and hopefully not crush it  ).
).
Cheers,
Thijs


