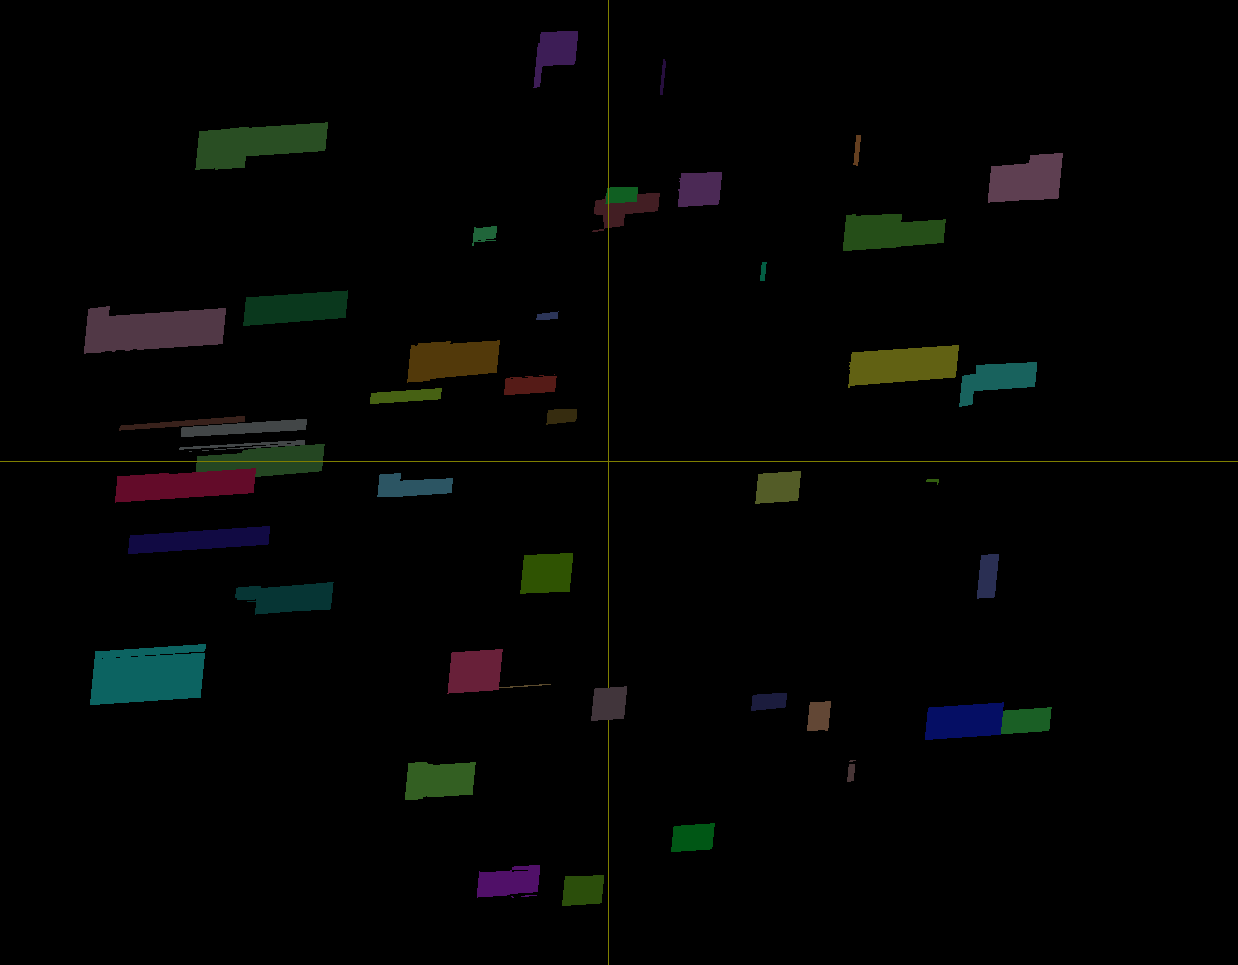
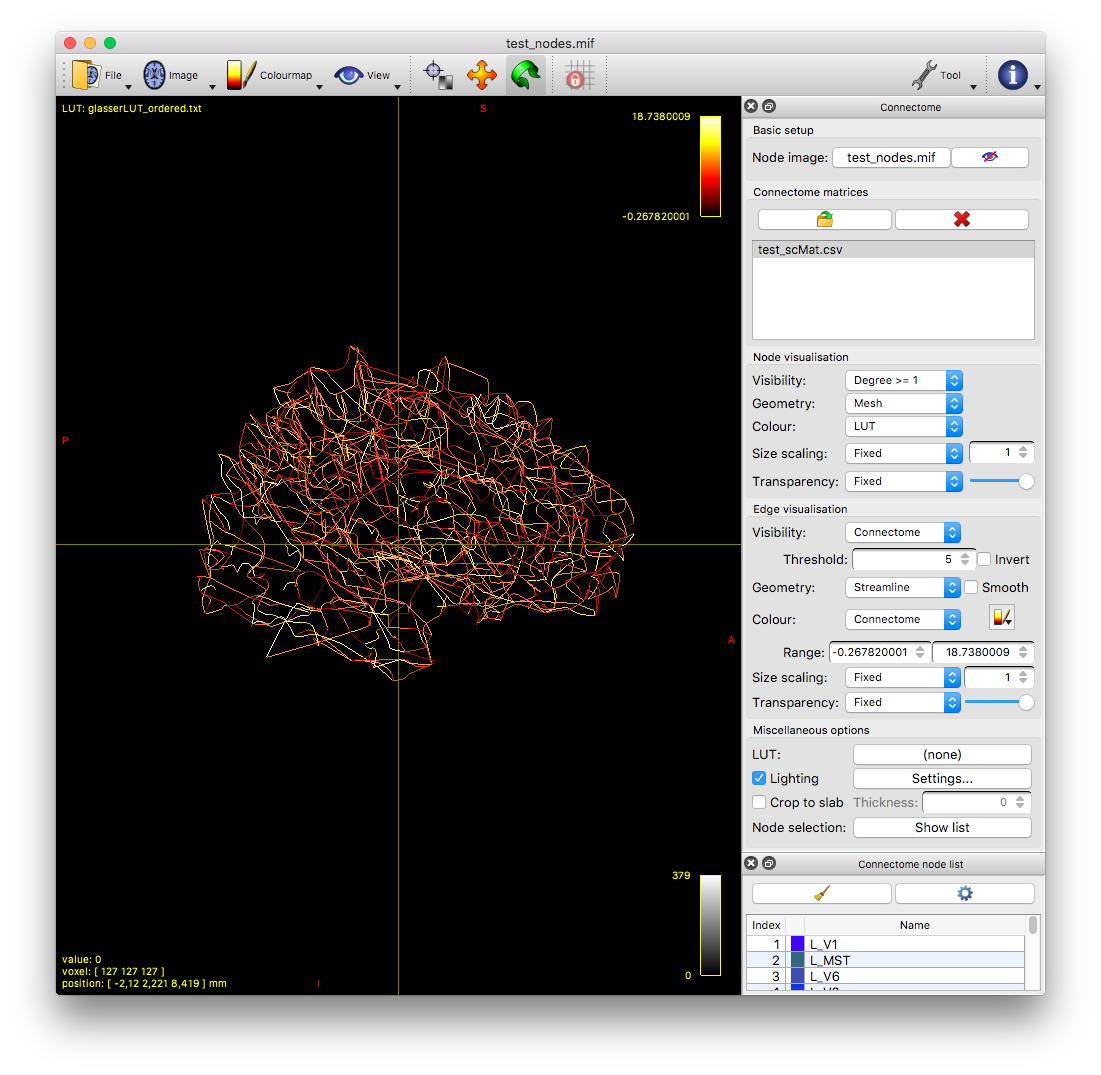
I’m having some trouble with the option "Node visualisation” - “Geometry” - ‘Mesh’. When I try to visualize nodes as meshes the surfaces are not correctly displayed. Instead of the mesh what I can see is a “slice” as you can see in the attached image:
It’s difficult to see exactly what’s gone wrong from a single screenshot, so I might need to get the data from you to have a look; preferably the node image, the .obj file and the connectome matrix, everything I would need to reproduce this exactly.
It is however worth clarifying / checking one thing: If you use label2mesh (particularly if you use the -blocky option), and don’t subsequently use meshfilter smooth, then each node will have a lot of polygons with identical normals, which correspondingly appear as homogeneous “blobs” of colour in the screen projection due to the relative simplicity of the lighting effects used (e.g. no ambient occlusion). It’s possible that the nodes are in fact all 3D blobs, they just don’t look as such from a static screenshot; simply rotating the camera around should answer this question. This effect is accentuated if your camera position is on the opposite side to the light source, since the diffuse & specular light components will be uniform for most polygons; try rotating the azimuth of the light source.
Some nodes also look like the centre of mass (where the edge lines converge) is outside the surface representation, which would be problematic if that is indeed the case.
I’ve emailed you the data I’m using. I’ve tried the mesh with and without the filter and the results are very similar, a thin slice or plane. Rotating the azimuth of the light source didn’t fix the issue.
The version of MRView I’m running is 3.0_RC2-132-ge25f7c6d on a Debian machine with NVidia drivers.
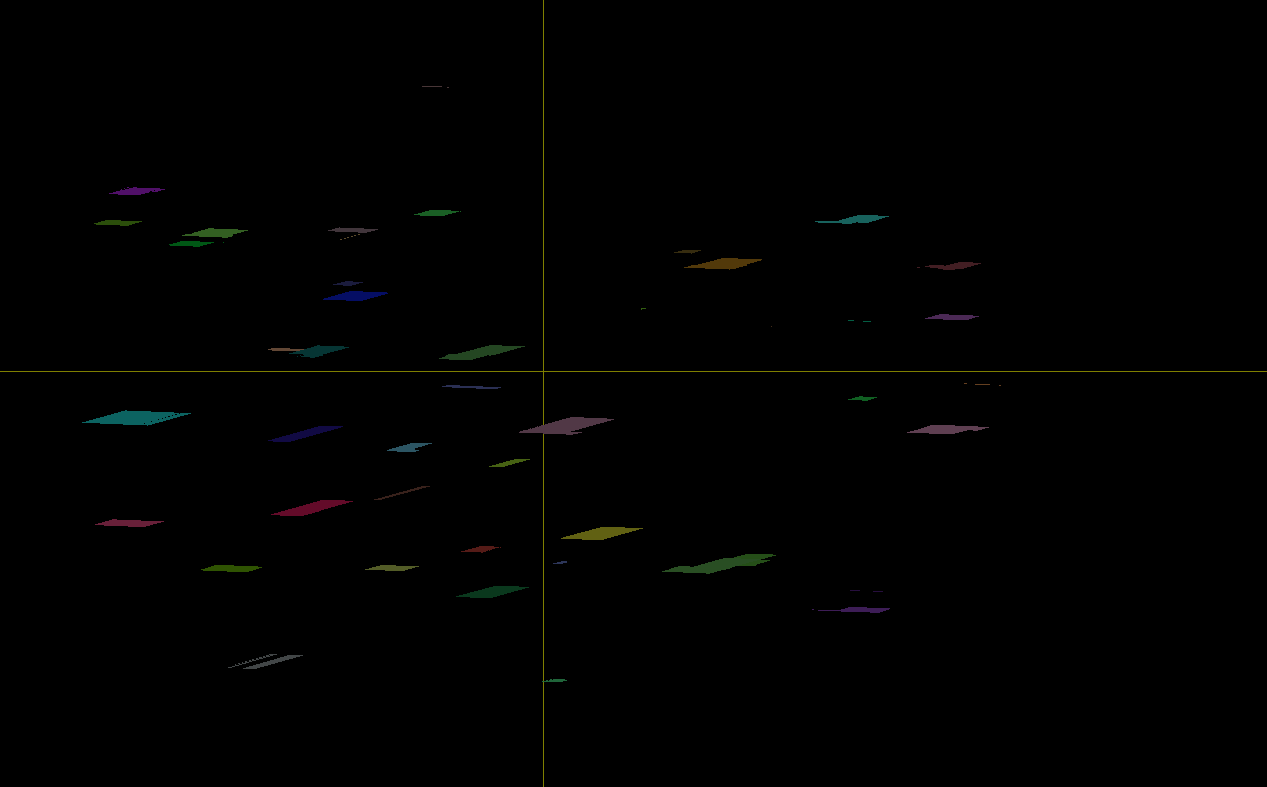
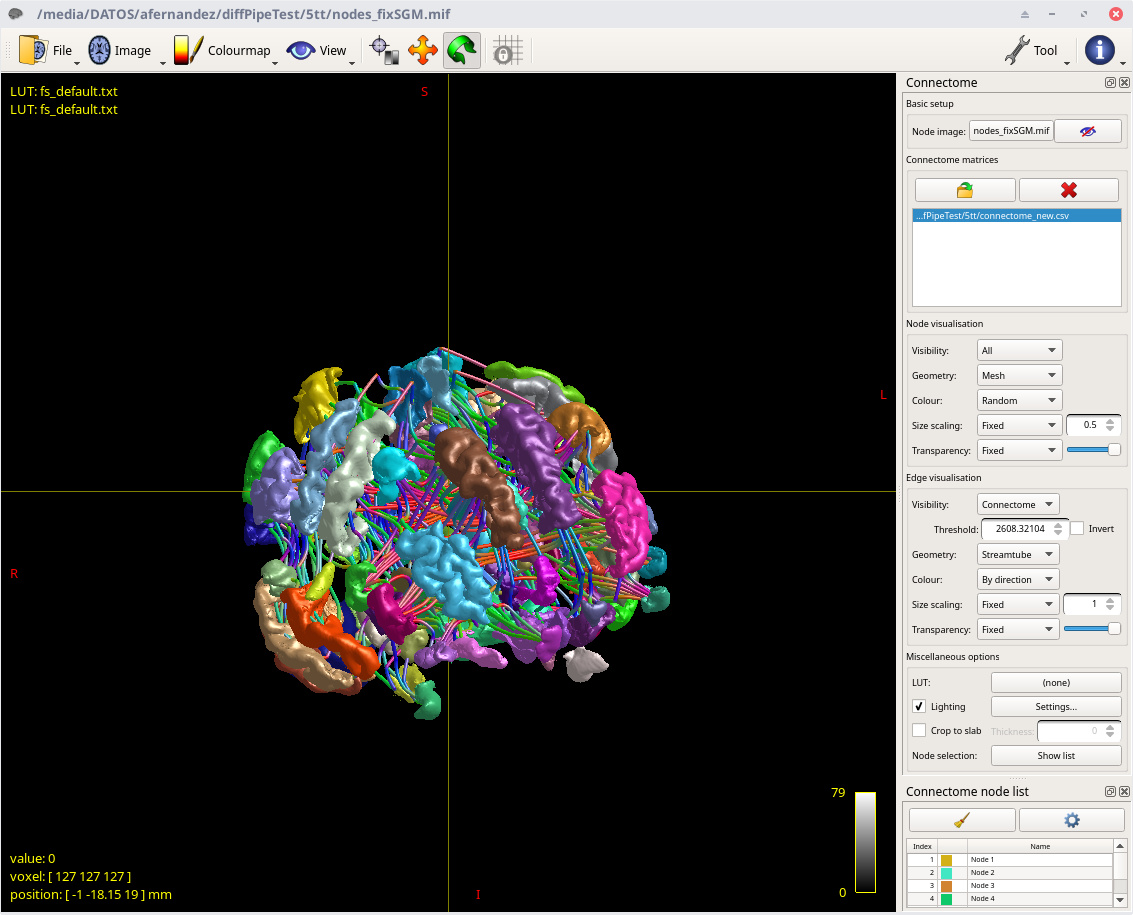
I also attach some new screenshots with different angle positions.
As you can see, the data are in fact perfectly fine. This would suggest that there’s something going wrong specifically with the visualisation on your system. Therefore can you provide:
What OS and version you’re running on
The output of mrview -version
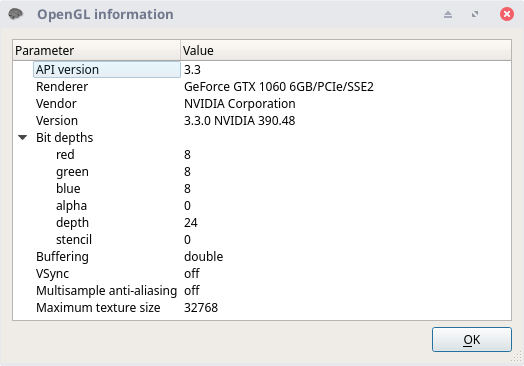
The contents of “OpenGL information” accessed via the blue “i” icon in the top-right corner of mrview
Whether or not you can produce / have produced any other kind of visual artifact using any other functionalities within mrview
You could also try viewing the same data on another machine if possible.
I’m running on Debian Testing (buster) with kernel 4.15.0-2-amd64. My output of mrview -version is:
== mrview 3.0_RC2-132-ge25f7c6d ==
64 bit release version, built Apr 10 2018, using Eigen 3.2.10
Here is a screenshot of what I have in the OpenGL information window:
I don’t remember any previous visual artifact with mrview. I’ve done visualization with spheres and cubes. I’ve also plotted ODFs without a problem.
I’ve tried viewing the data I sent you in a Ubuntu 16.04 with Intel Graphics and in my laptop with Debian Testing with Intel Graphics too and I have the same problem in all of them.
I’ve also tried to run mrview with -debug flag, but I didn’t see any relevant message. If you want me to try something else, please tell me.
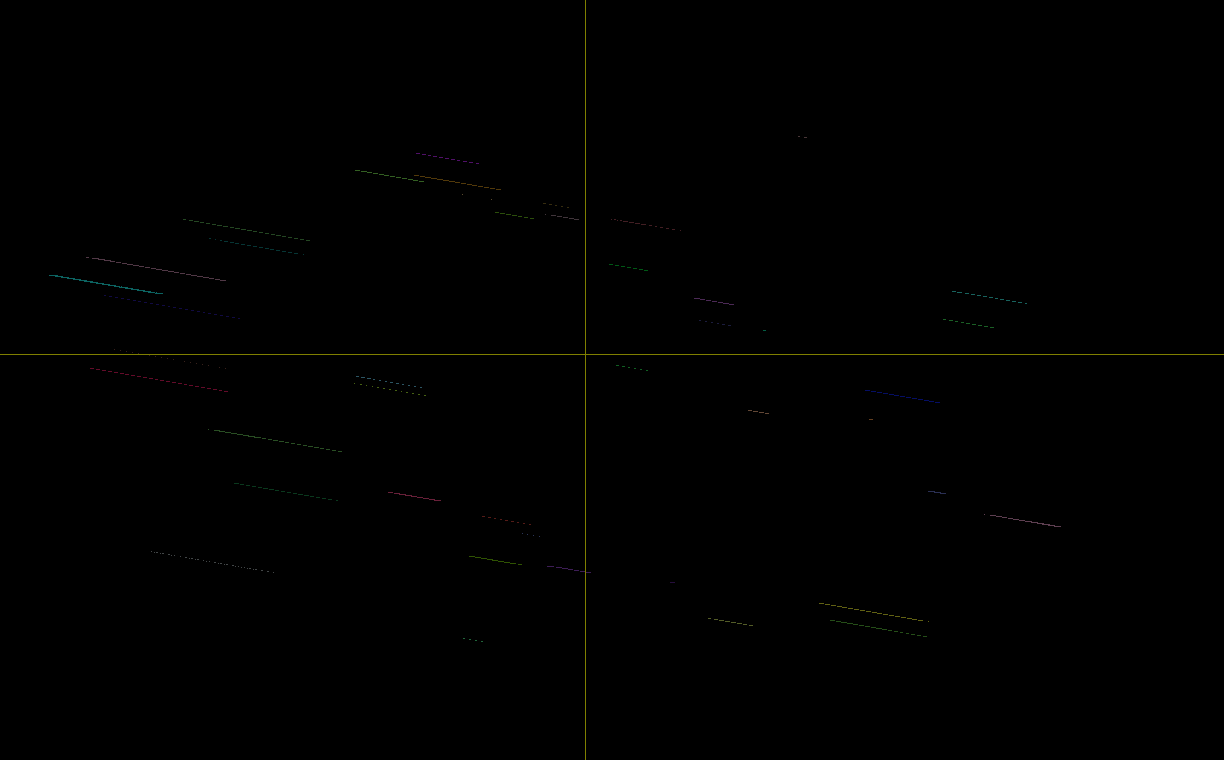
I’m not sure if you could solve the problem yet, but I also have troubles displaying meshes: When I try to visualize nodes as meshes, I can’t see anything in mrview:
I’m pretty stumped on this one. Only possibility I could think of is that you’re both using machines with big-endian encoding, and that causing issues with the .obj file format… Could you both check what your config file reports with respect to endianness?
If that’s not it, I’d probably need one or both of you to re-run the test using the instructions on the advanced debugging documentation page.
I checked my .config file. There is just one comment on endianness ("# Detecting byte order: little-endian"), but nothing in the code. There are however a few lines on endianness in the .configure file:
What you’ve printed subsequent to that is the Python code that is responsible for detecting the endian-ness of your system. But given that configure is a script that executes, it tells me nothing about the result of that test when run on your system; that’s what the contents of the file config tell me.
I tried to run the advanced debugging but ran over some problems: When running the ./configure -debug -assert, I ran over the following error message:
“MRtrix3 was unable to compile a test program involving Eigen3”.
I then adjusted the EIGEN_CFLAGS environment as suggested by the error message. After running the ./configure again, there was a similar problem with the qt5 ("MRtrix3 was unable to locate the Qt meta-object compiler ‘moc’), and again I adjusted those paths as suggested. After that, I tried running the ./configure a third time, this time receiving:
ERROR: qmake returned with error:
Project ERROR: Could not resolve SDK Path for ‘macosx10.12’
ERROR: unexpected exception!
I then went on to check the configure.log file, but couldn’t identifiy the error. Can you help?
For some reason, I’ve been able to run mrview without problems using the “Start debugging” option in the Qt Creator GUI. I’ve tried running the same binary from bash with and without gdb and I can’t view the meshes in those cases.
Also, running in debug mode from Qt Creator allows me to load streamtubes.
I’m stumped. I just checked this on my Arch Linux setup, and my Win10 MSYS2 laptop, everything works as expected. But given the issues raised in this thread, there’s a suggestion of a funny interaction with Qt5 that might be causing issues. Maybe you could try removing the Qt5 development packages, installing the Qt4 equivalent packages, then running ./configure and ./build again, and see if that fixes the issue?
Otherwise, I’ve no idea how the same binary executed within the Qt debugger could possibly behave differently outside of it. But it does suggest a potential memory issue, I’ll have a look into that next week if I find the time…
I’m not sure a debug build is necessarily going to help if the software doesn’t crash outright. I wouldn’t bother, just keep using the version you’ve already installed (through homebrew, presumably?). It seems there are issues somewhere in the OpenGL handling, given that similar issues are being reported on other systems. This is not something you’ll be able to fix or even investigate very easily. Unfortunately I’m not in a position to replicate the issue, but I’ll give it a shot next week if I find the time…
After some debugging, we’ve reached the conclusion that it seems to be a problem with the LC_NUMERIC locale. We have our systems configured in Spanish, where “,” is the decimal separator. This can be causing the sscanf (data.c_str(), “%f %f %f %f”, &values[0], &values[1], &values[2], &values[3]);
reads wrong positions.
If we include something like this
import <locale.h>
…
setlocale(LC_NUMERIC, “C”);
in the MeshMulti::load function, meshes work fine.
I’m not sure if that can be the related to what is happening with streamtubes.
Alberto.
EDIT: “locale.h” was wrong. It should be <locale.h> because the previous had a compilation error.
I have installed mrtirx through macports instead of homebrew. I guess that makes no difference? Unfortunately, Alberto’s suggestion to change the MeshMulti::load function doesn’t do the trick for me. Would you need the data I’ve been using to replicate the issue?
Wow, great work! That can’t have been easy to track down…
This sounds similar to this issue that @bjeurissen encountered a while back. The added problem there was that this was internal to Qt, which meant we couldn’t modify the code – there was nothing we could do other than modify the locale, in pretty much the same way as you suggest.
However, in this instance, we do have control of the relevant code. @rsmith, I suggest we change the problematic line from what it is now:
Not really, but it will affect the exact procedure and the specific flags that might need to be set in the configure call. So it helps to know if we’re trying to help you to compile a debug build. You should be able to use the exact same steps as you must have used to compile your original installation, but with -assert -debug at the end of the ./configure line – everything else should be the same…
I think we’ll need to take a look at the data to get to the bottom of this. But before we do, it might be worth looking into whether you might not have the reverse issue: maybe the numbers are written in the file using the comma as the decimal separator, and your locale is set to use a dot? Can you look at the file in a text editor and see how the numbers are stored? It should be just text…
OK, so here are the first few lines of my .obj file:
# mrtrix_version: 3.0_RC2-37-gb4bca32f
o none
o 1
v -31.120390560477745 -56.278932370245329 -16.580981446196731 1.0
v -31.620390579104196 -55.778932373970619 -16.580981401260416 1.0
v -31.120390597730648 -55.778932400047651 -17.080981490667384 1.0