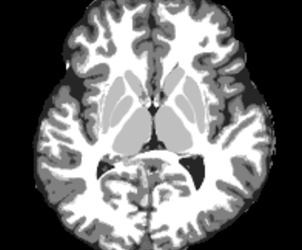
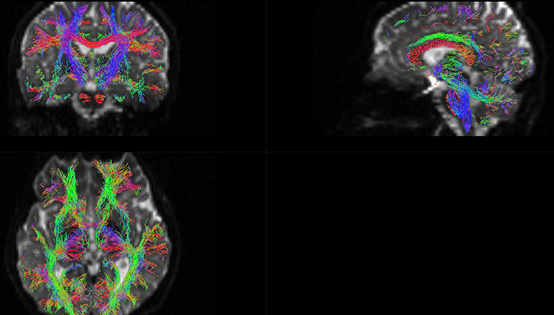
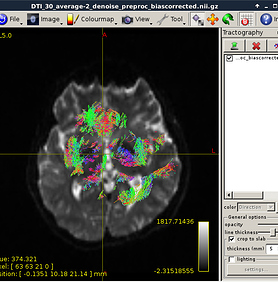
Beginner: Connectome pipeline (MRtrix3, FSL and Freesurfer)

Hi MRtrix Community,

I wanna to study a patient dataset. So, I followed ElijahMak’s workflow to generate the connectome pipeline. However, it is not recommended to segment brain structure by FreeSurfer. So, I tried to use FSL to generate the connectome. My understanding is that I just need to use FSL instead of FreeSurfer in the registration step. I mainly follow their work to do registration by using FLIRT.

I would really appreciate it I could get some advice on the basic workflow below. Also, I hope it would be helpful for those other beginners who start to learn the connectome using MRtrix3.

Thank you very much.

Example Dataset description

The dataset is as shown:
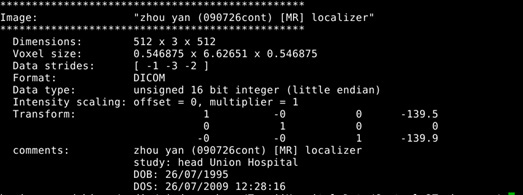
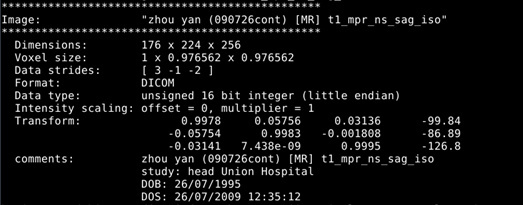
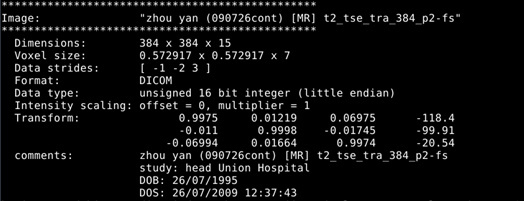
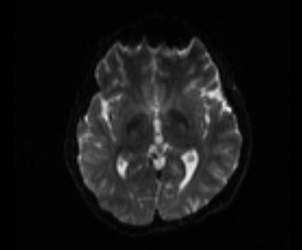
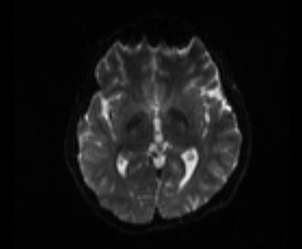
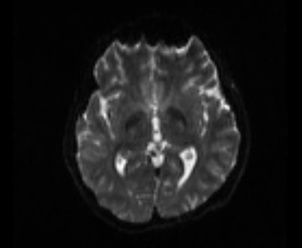
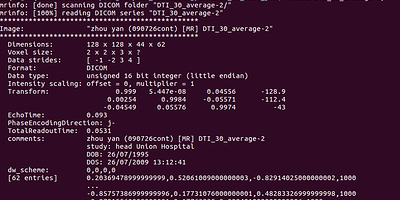
They belongs to the same paitent, the mrinfo shown below. As I guess, the “DTI_30_average-2” folder is the storage for DWI data, “t1_mpr_ns_sag_iso” folder is the storage for T1 data, and “t2_tse_tra_384_p2-fs” is the storage for T2 data, I have no idea about “localizer” folder.
(I have acquired the permission to use the data, and also allowed to shown it to public)

A ). Registration of T1 to DWI
(using boundary-based registration(bbr) )

  1. data convert (dcm to nifti)

     mrconvert  t1_mpr_ns_sag_iso/  t1_mpr_ns_sag_iso.nii.gz 
     mrconvert  DTI_30_average-2/   DTI_30_average-2.nii.gz
    
  2. align T1 to DWI (the same subject)

     flirt -in t1_mpr_ns_sag_iso.nii.gz -ref DTI_30_average-2.nii.gz -dof 6 -omat tmp_t1-dwi.mat
    
  3. register to MNI space (using FSL standard white matter segmentation image)

    flirt -in t1_mpr_ns_sag_iso.nii.gz -ref DTI_30_average-2.nii.gz -dof 6 -cost bbr -wmseg /usr/share/fsl/data/standard/MNI152_T1_1mm.nii.gz -init tmp_t1-dwi.mat -omat diff_to_template-bbr.mat -schedule /usr/share/fsl/5.0/etc/flirtsch/bbr.sch

  4. transform the flirt matrix to mrtrix format

    transformconvert diff_to_template-bbr.mat t1_mpr_ns_sag_iso.nii.gz DTI_30_average-2.nii.gz flirt_import diff_to_template-bbr.mat.txt

  5. apply to the DWI image

    mrtransform DTI_30_average-2.nii.gz -linear diff_to_template-bbr.mat.txt t1_mpr_ns_sag_iso_coreg.nii.gz –inverse

B. DWI Processing

  1. Denoise DWI

    dwidenoise DTI_30_average-2/ DTI_30_average-2_denoise.mif

2 . Process DWI data

dwipreproc -rpe_none AP DTI_30_average-2_denoise.mif DTI_30_average-2_denoise_preproc.mif 

3 . inhomogeneity correction for DWI data

dwibiascorrect DTI_30_average-2_denoise_preproc.mif DTI_30_average 2_denoise_preproc_biascorrected.mif –fsl

4 . Estimate response function

dwi2response tournier DTI_30_average-2_denoise_preproc_biascorrected.mif DTI_30_average-2_denoise_preproc_biascorrected_response.txt

5 . FOD

dwi2fod csd DTI_30_average-2_denoise_preproc_biascorrected.mif DTI_30_average-2_denoise_preproc_biascorrected_response.txt DTI_30_average-2_denoise_preproc_biascorrected_fod.mif

C. T1 Processing

1 . Derive tissue-segmented image (generate 5TT data)

5ttgen fsl t1_mpr_ns_sag_iso.mif  t1_mpr_ns_sag_iso_5TT.mif

2 . Visualize 5TT

5tt2vis t1_mpr_ns_sag_iso_5TT.mif t1_mpr_ns_sag_iso_5TT_vis.mif

3 . Convert a connectome node image

labelconvert t1_mpr_ns_sag_iso.nii.gz /usr/share/fsl/5.0/etc/luts/fsrandlut.txt /home/brain/mrtrix3/src/connectome/tables/fs_default.txt t1_mpr_ns_sag_iso_nodes.mif

Error: Segmentation fault

4 . Checkout T1 stats

mrstats t1_mpr_ns_sag_iso.nii.gz

as the result shown: the minimum value is 0, not negative.

D. Connectome generation

1 . Streamline Tractography

tckgen DTI_30_average-2_denoise_preproc_biascorrected_fod.mif  DTI_30_average-2_denoise_preproc_biascorrected.tck -act t1_mpr_ns_sag_iso_5TT.mif -backtrack -crop_at_gmwmi -seed_dynamic DTI_30_average-2_denoise_preproc_biascorrected_fod.mif -number 20000 -maxlength 250

2 . Perform SIFT

tcksift DTI_30_average-2_denoise_preproc_biascorrected.tck DTI_30_average-2_denoise_preproc_biascorrected_fod.mif DTI_30_average-2_denoise_preproc_biascorrected_sift.tck -act t1_mpr_ns_sag_iso_5TT.mif -term_number 15000 

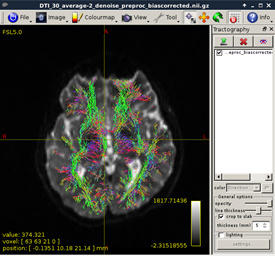
The fibers are very strange, especially the right-top one. A lot of short fibers scattered on the surface.

Because I am not able to generate the connectome node image, I can not go on the work.
Can anyone give some tips?

Thanks,
Chaoqing.

2 Likes

Hi Chaoqing,

However, it is not recommended to segment brain structure by FreeSurfer. So, I tried to use FSL to generate the connectome.

There may be some confusion regarding the linked documentation page. In general I don’t recommend use specifically of the 5ttgen freesurfer algorithm. However I need to make two clarifications:

  • Firstly, this recommendation applies specifically to the 5ttgen freesurfer algorithm as implemented currently, and is not a criticism of FreeSurfer as a whole;

  • Secondly, this is specifically relevant to the use of ACT in tractogram generation. It’s very important to disambiguate between the tractogram and the connectome: There’s nothing stopping you from using one piece of software to do the tissue segmentation for tractography, and another to provide the parcellation for connectome construction.

My understanding is that I just need to use FSL instead of FreeSurfer in the registration step.

I’m not quite sure what you mean here: If you change from one software to another for connectome construction as a whole, that will inevitably require more changes than just the command used for registration.

3 . Convert a connectome node image

You appear to be providing a T1 image as input to the labelconvert command. This is never going to work: That command converts a parcellation image from one lookup table to another, it does not perform a parcellation.

Nevertheless, the command should not be getting a segmentation fault; I’ll have to look into that.

1 . Streamline Tractography

I hope you’re eventually going to generate more than 20,000 streamlines :stuck_out_tongue:

2 . Perform SIFT

Reducing the number of streamlines by only 25% is unlikely to fully correct for streamlines density reconstruction biases.

The fibers are very strange, especially the right-top one. A lot of short fibers scattered on the surface.

There’s probably a few factors here that may make the result appear differently to what you expected:

  • ACT by default will not permit streamlines to pass through the cortical grey matter. Therefore when you look at an area dominated by cortex, with only very thin superficial white matter between sulci, the streamlines can only exist within those narrow bands.

  • ACT by default permits much shorter streamlines than many other software packages. This means that very short U-fibres or streamlines crossing between adjacent banks can be reconstructed.


Rob

Hi, Rob,

Thanks for your comments. I have improved the pipeline with dani’s workflow and get the connectome. I hope it would be helpful for those MRtrix beginners.

A) Segmentation(T1)

  1. Cortical Segmentation (Freesurfer, 6.27 hours)

    recon-all -i t1_mpr_ns_sag_iso.nii.gz -s Control_3T_zhou_yan_bert -all -openmp 8

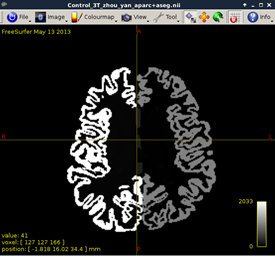
  2. Change the name of the file aparc+aseg

    cp aparc+aseg.mgz ../../Control_3T_zhou_yan_aparc+aseg.mgz

  3. Change the format of the segmentation file (Freesurfer)

    mri_convert Control_3T_zhou_yan_aparc+aseg.mgz

    Figure1:
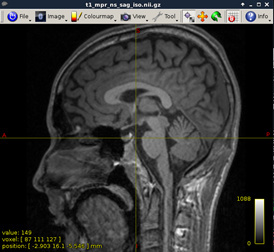
  4. Visualize T1 data (MRtrix)

    mrview t1_mpr_ns_sag_iso.nii.gz

    Figure2:
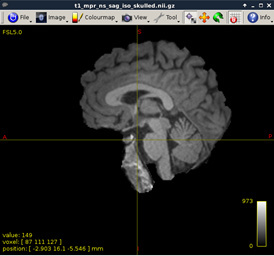
  5. Extract the brain, because the skull can cause problem (FSL)

    bet t1_mpr_ns_sag_iso.nii.gz t1_mpr_ns_sag_iso_skulled.nii.gz -R

    Figure 3:
  6. Derive tissue-segmented image (generate 5TT data) (MRtrix)

    5ttgen fsl t1_mpr_ns_sag_iso.nii.gz t1_mpr_ns_sag_iso _5TT.mif

    Figure 4:
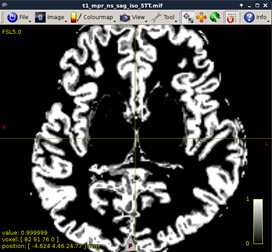
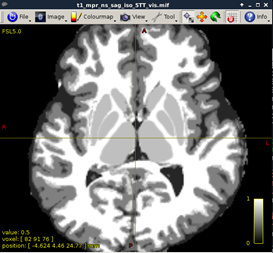
  7. Visualize 5TT (MRtrix)

    5tt2vis t1_mpr_ns_sag_iso_5TT.mif t1_mpr_ns_sag_iso_5TT_vis.mif

    Figure 5:
B) DWI Processing

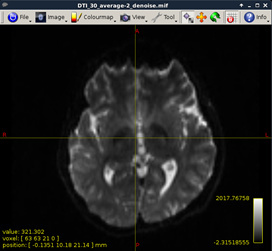
  1. Denoise DWI (MRtrix)

    dwidenoise DTI_30_average-2.nii.gz DTI_30_average-2_denoise.mif

    Figure 6:
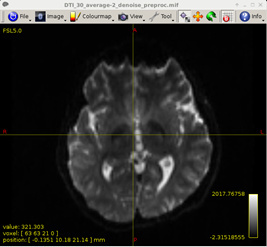
  2. Preprocess DWI data (MRtrix)

    dwipreproc -rpe_none AP DTI_30_average-2_denoise.mif DTI_30_average-2_denoise_preproc.mif

    Figure 7:
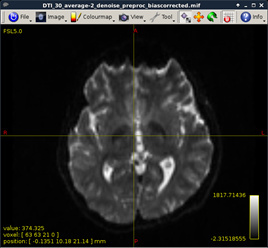
  3. Inhomogeneity correction for DWI data (MRtrix)

    dwibiascorrect DTI_30_average-2_denoise_preproc.mif DTI_30_average-2_denoise_preproc_biascorrected.mif –fsl

    Figure 8:
  4. Create Nift data and its bvecs and bvals (MRtrix)

    mrconvert DTI_30_average-2_denoise_preproc_biascorrected.mif DTI_30_average-2_denoise_preproc_biascorrected.nii.gz -export_grad_fsl DTI_30_average 2_denoise_preproc_biascorrected.bvecs DTI_30_average-2_denoise_preproc_biascorrected.bvals

  5. Creat mask (MRtrix)

    dwi2mask DTI_30_average-2_denoise_preproc_biascorrected.nii.gz -fslgrad DTI_30_average-2_denoise_preproc_biascorrected.bvecs DTI_30_average-2_denoise_preproc_biascorrected.bvals DTI_30_average-2_denoise_preproc_biascorrected_mask.nii

    Figure 9:
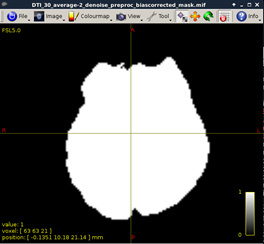
  6. Estimate response function (MRtrix)

    dwi2response tournier DTI_30_average-2_denoise_preproc_biascorrected.mif DTI_30_average-2_denoise_preproc_biascorrected_response.txt

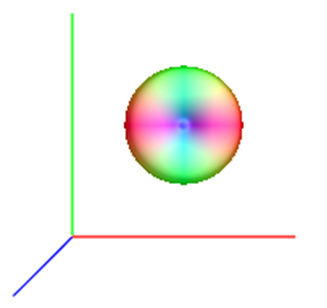
    Figure 10:
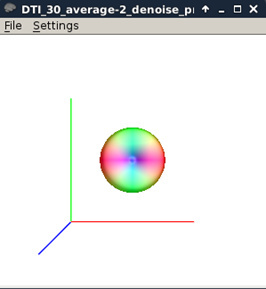
  7. Obtain the Fiber orientation distribution (MRtrix)

    dwi2fod csd DTI_30_average-2_denoise_preproc_biascorrected.mif DTI_30_average-2_denoise_preproc_biascorrected_response.txt DTI_30_average-2_denoise_preproc_biascorrected_fod.mif

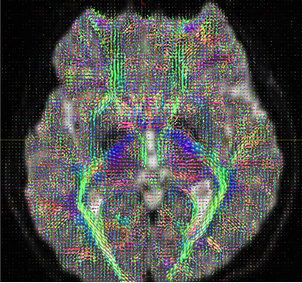
    Figure 11:
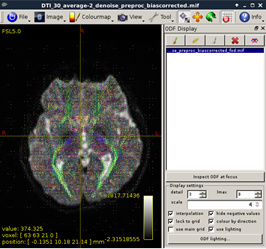
  8. Obtain a lot of parameters(tensors), including FA, MD values (FSL)

    dtifit -k DTI_30_average-2_denoise_preproc_biascorrected.nii.gz -o DTI_30_average-2_denoise_preproc_biascorrected -m DTI_30_average-2_denoise_preproc_biascorrected_mask.nii -r DTI_30_average-2_denoise_preproc_biascorrected.bvecs -b DTI_30_average-2_denoise_preproc_biascorrected.bvals

C) Registration of T1 to DWI

  1. align T1 to DWI (the same subject) (FSL)
`flirt -in t1_mpr_ns_sag_iso.nii.gz -ref DTI_30_average-2_denoise_preproc_biascorrected.nii -dof 6 -omat tmp_t1-dwi.mat`
  1. register to MNI space (using FSL standard white matter segmentation image)(FSL)

    flirt -in t1_mpr_ns_sag_iso.nii.gz -ref DTI_30_average-2_denoise_preproc_biascorrected.nii.gz -dof 6 -cost bbr -wmseg /usr/share/fsl/data/standard/MNI152_T1_1mm.nii.gz -init tmp_t1-dwi.mat -omat diff_to_template-bbr.mat -schedule /usr/share/fsl/5.0/etc/flirtsch/bbr.sch

  2. transform the flirt matrix to mrtrix format (MRtrix)

    transformconvert diff_to_template-bbr.mat t1_mpr_ns_sag_iso.nii.gz DTI_30_average-2_denoise_preproc_biascorrected.nii.gz flirt_import diff_to_template-bbr.mrtrix.mat

  3. apply to the T1 image (MRtrix)

    mrtransform t1_mpr_ns_sag_iso_5TT.mif -linear diff_to_template-bbr.mrtrix.mat t1_mpr_ns_sag_iso_5TT_wrped.nii.gz –inverse

    Figure 12:
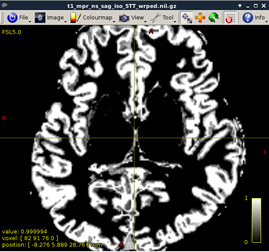
  4. do parcellation (FSL)

    labelconvert Control_3T_zhou_yan_aparc+aseg.nii /usr/local/freesurfer/FreeSurferColorLUT.txt /home/brain/mrtrix3/src/connectome/tables/fs_default.txt Control_3T_zhou_yan_aparc+aseg_lut.nii

D) Tractography && Connectome

  1. Streamline Tractography (MRtrix)

    tckgen -act t1_mpr_ns_sag_iso_5TT_wrped.nii.gz DTI_30_average-2_denoise_preproc_biascorrected_fod.mif DTI_30_average-2_denoise_preproc_biascorrected_act.tck -crop_at_gmwmi -seed_dynamic DTI_30_average-2_denoise_preproc_biascorrected_fod.mif -number 20000

  2. Perform SIFT (MRtrix)

    tcksift DTI_30_average-2_denoise_preproc_biascorrected_act.tck DTI_30_average-2_denoise_preproc_biascorrected_fod.mif DTI_30_average-2_denoise_preproc_biascorrected_act_sift.tck -act t1_mpr_ns_sag_iso_5TT.mif -term_number 10000

It seems very messy. I don’t know why ElijahMak can get a very nice result. Is there anything wrong when I do fiber orientation distribution? Or probably, I got a low quality dataset.

Figure 13:
3 . tck to vtk (MRtrix)

`tckconvert DTI_30_average-2_denoise_preproc_biascorrected_act_sift.tck 
DTI_30_average-2_denoise_preproc_biascorrected_act_sift.vtk`

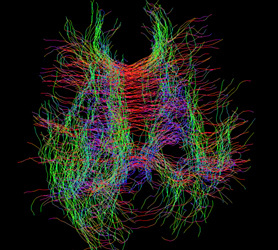
Then I render the fibers by myself. However, it is so… ugly, so I wonder if there’s anything wrong in the workflow. The fibers seem twisted, especially the blue fibers. Also, I can not find corpus callosum fibers which should be very obvious. Do you have any ideas?

Figure 14:
4 . Connectome Matrix (MRtrix)

 `tck2connectome DTI_30_average-2_denoise_preproc_biascorrected_act_sift.tck Control_3T_zhou_yan_aparc+aseg_lut.nii Control_3T_zhou_yan_connectome.csv -zero_diagonal`

I didn’t transform the matrix into a symmetric form where M is matrix
M = M + triu(M,1). For the CSV file is not compatible with Matlab with the message: “The input character is not valid in MATLAB statements or expressions”

5 . View the connectome (MRtrix)

mrview Control_3T_zhou_yan_aparc+aseg_lut.nii -connectome.init 
Control_3T_zhou_yan_aparc+aseg_lut.nii -connectome.load 
Control_3T_zhou_yan_connectome.csv

Figure 15:
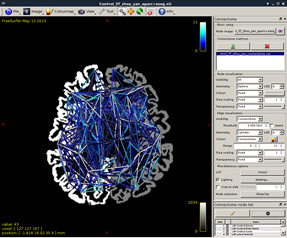
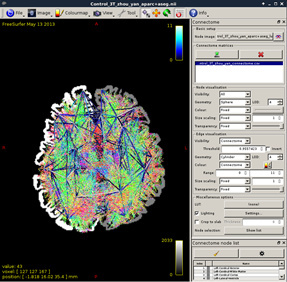
Figure 16:

Though the connectome has been generated, I still have some questions:

① About fiber skull extraction:

As shown in current workflow, Figure 2 and Figure 3 (removed the skull) are in Left-Right orientation. Figure 2 corresponds to T1 data, and Figure 3 corresponds to T1 data(removed the skull). With T1 data, the generated fibers are shown in Figure 13, but with T1 data (removed the skull), the generated fibers are shown in Figure 17, which is obviously incorrect.

Figure 17:

② about fiber generation

Is there anything wrong with my T1 data or DWI data? I think the fibers are abnormally twisted, as shown in Figure 13 and Figure 14.

Jiangjiane has the same issue. However, I don’t quite understand what does Donald mean when he feedbacks to Jiangjiane “This is to be expected with probabilistic tractography”. Because I always thought ACT tractography is also streamline tractography. As shown in the paper, “We have introduced a novel framework for incorporating prior anatomical information into the diffusion MR streamlines tractography”

③ about registration

I think I probably have some misunderstanding of registration. I use FSL to do registration, and I follow kerstin’s steps, and your comment:“Personally I have always registered T1 to (pre-processed) DWI before anatomical image processing (including before importing to FreeSurfer);”

my current registration:
First, register the T1 data to DWI data. The transformation for this is saved as “tmp_t1-dwi.mat” in my current workflow. Second, register the T1 data to template data (here is “MNI152_T1_1mm.nii.gz”), the transformation is saved as “diff_to_template-bbr.mat”.
(register T1 to DWI, then register T1 to template, then do parcellation for T1 data)

Here is some instruction on FSL registration: “Typically, registration in FEAT is a two-stage process … …”.
My understanding:
(register DWI to T1, then register T1 to a template, then do parcellation for DWI data. Here in my data, DWI is low-resolution image, and T1 is high-resolution image)

I. Single-subject registration
Is it wrong with my registration? I am still not clear about the registration among T1 data, DWI data and Template data. What role is mrregister played in registration?

II. Multi-subject registration
If I want to do the multi-subject comparison, what should I do for registration? Does it mean I have to register all the DWI file or T1 file into the same template image?

In other words, does it mean I have to deform ( T1 or DWI image ) to (template image ), but not deform (template image) to ( T1 or DWI image )?

④ about connectome
Do the nodes of the connectome means the center of the functional area? If so, can I calculate the coordinates of the nodes to make it in the same coordinate system as the fibers?

I’m so… sorry for asking so many questions at a time. :sweat_smile:
I hope not to trouble you a lot.:water_buffalo:

Thanks,
Sincerely,

Chaoqing

That’s indeed a lot of questions… I’ll try to address a few, but I’ll no doubt miss some here.

Your bet call clearly results in too restrictive a brain mask. There’s a few parameters you can play with to get better results, including the -f, -r, and -c options. This will affect your results in your question 1. Also, I don’t see the need for skull stripping on the T1… (?)

I note you don’t perform any correction for EPI distortions, yet use the ACT option for tckgen. This is not recommended - you won’t get sufficiently accurate alignement with an affine-only registration between the T1 and the distorted EPI data. This will lead to incorrect terminations, etc. - which you can see in the frontal (heavily distorted) regions in your figure 13.

Individual streamlines can look messy, but it’s expected given the probabilistic nature of the algorithm. But for your purposes, you won’t get ‘nice’ results with only 10k streamlines… That’s nowhere near enough to adequately sample the space of probable streamlines. You need to be thinking at least in the millions to get a stable connectome - bear in mind the tractography is probabilistic, a ballpark figure is you’re after maybe ~1k streamlines per seed location (that’s a very rough suggestion, by the way). For a ROI that contains ~100 voxels, you’d be looking at 100k streamlines for that region alone. Ideally, you’d be producing of the order of 50-100 million streamlines, and using SIFT to bring that down to the order of 10M…

The best thing to do is to repeat the process a few times and get an idea of the variability in the resulting connectome matrix. If you have too few streamlines, then the random nature of the process will introduce a lot of variability in your output. You need to experiment to find how many streamlines are required to converge to a sufficiently stable answer.

The Anatomically Constrained Tractography concept is completely independent of the probabilistic nature of the tractography. All ACT will do is ensure that the streamlines terminate in appropriate locations - it has no influence whatsoever with how those streamlines propagate. And the default algorithm for streamlines propagation is probabilistic (iFOD2). What that means is that the direction of propagation at each step is a probabilistic sample for the distribution of possible fibre orientations at that location - this will inevitable introduce some random ‘jitter’ in the streamline trajectories.

The blue fibres correspond to those travelling through plane in your figure, and if you display their entire trajectory as in your Figure 14, they’ll inevitably look ‘wrong’: you’re collapsing a large travel in the z direction onto the x-y plane, which exaggerates what might be perfectly sensible twists and turns. You need to have a look at these in the coronal or sagittal planes, and ideally rotate the view dynamically to appreciate their trajectory properly.

They’re pretty obvious to me: you show lots of mid-sagittal red (left-right) streamlines (?). The bigger problem is that you’re using so few streamlines, and using SIFT on top of that, that there’s not that many of them to display. But that is something you should fix by increasing the numbers to something more sensible. For visualisation purposes, I find 100-200k streamlines is sufficient (without SIFT); for quantification you need to increase that massively, as I mentioned above.

Not sure I get what you’re after here… The nodes correspond to the parcellated regions of interest you provided to tck2connectome, which you derived using FreeSurfer’s recon_all, in particular its aparc+aseg.mgz output. These nodes are anatomical parcellations based on the Deskian/Killiany atlas (by default) - there’s nothing ‘functional’ about them (?). Also not sure why you need to calculate their coordinates…? The streamlines are stored in the real/scanner/world coordinates already (?).

Hi,Donald

I note you don’t perform any correction for EPI distortions, yet use the ACT option for tckgen.

As I think dwipreproc is used to do inhomogeneity distortion correction,which is include EPI distortion. Do I misunderstand it? or I need to use FSL tool fugue to do EPR distortion correction?

and here is my data information:
what does PhaseEncodingDirection: j- mean? Does it mean all the DWI volumes are with reversed phase encode?

and here is the b value:
only the first dcm data is of b balue 0, the others are of b value 1000.

These nodes are anatomical parcellations based on the Deskian/Killiany atlas (by default) - there’s nothing ‘functional’ about them (?). Also not sure why you need to calculate their coordinates…? The streamlines are stored in the real/scanner/world coordinates already (?)

as shown in figure 16 to merge the node and streamline together. I want to know what the corresponding coordinates of the nodes, for I find some researchers have used the similar nodes ,and I want to repeat their work.

Thanks,
Chaoqing

dwipreproc can be used for EPI distortion correction if supplied with matching reversed phase-encoded EPI images - this is done using FSL’s TOPUP. It looks like you don’t have suitable data for this step, and furthermore you pass the -rpe_none option to dwipreproc, which explicitly disables EPI distortion correction.

Well, it means all your data were acquired with the phase encode direction running along the negative y axis. But what we mean when we talk of reversed phase encode images is the available of images acquired with the opposite phase encode direction to the rest of the DWI data. That would generally be a separate set of images to the main DWI series.

OK, my point was that these nodes are not defined on the basis of functionality. If you want the node coordinates, maybe the simplest thing is to generate an image of the coordinates of each voxel (you can use warpinit for that), and then measure the mean value within your node ROI. This depends on your ROI being a binary mask, rather than an image of integer labels. But you can convert it to a binary image using mrcalc.

To provide an example of what I mean, assuming your parcellation is an image of labels, and you want to extract the mean position for node index 15, first generate an image of voxel positions (you only need to do this once):

warpinit nodes_image.nii positions.mif

then compute the mean value of these positions within the voxels that have value 15:

mrcalc nodes_image.nii 15 -eq - | mrstats positions.mif -mask - -output mean

(above not tested, but hopefully close enough as a starting point…)

1 Like

is it ok to use that image as wmseg?

umm… Good question!
It probably not correct, but it looks like the registration works well from the result.
I should firstly extract white matter segmentation image from MNI152_T1_1mm.nii.gz.

Actually, I’m more accustomed to doing registration simply by using flirt:

A ). Registration of T1 to DWI

 mrconvert  t1_mpr_ns_sag_iso/  t1_mpr_ns_sag_iso.nii.gz 
 mrconvert  DTI_30_average-2/   DTI_30_average-2.nii.gz

flirt  -in  t1_mpr_ns_sag_iso.nii.gz  -ref  DTI_30_average-2.nii.gz -omat T12DTI.mat

flirt  -in  t1_mpr_ns_sag_iso.nii.gz  -ref  DTI_30_average-2.nii.gz  -applyxfm  -init  T12DTI.mat  -out T1_inDTIspace.nii.gz

Thank you for pointing out my mistake!
Regards,
Chaoqing

Hello all,

I have generated a human whole brain tractogram using the Mrtrix pipeline, and I have filtered streamlines with ROIs (-tckedit). I want to study if these filtered streamlines are from known bundles (e.g.arcuate fasciculus). The bundle extraction was performed with FSL (Probtrackx). Can I compare the streamlines generated by Mrtrix (my connectome) and FSL (the bundles)?
If not, is it possible to extract the bundles with MRtrix (-tckedit)? If so, what is the equivalent of the --waypoint parameter of FSL which is complementary to -seed and -target?

Thanks,
Mélina